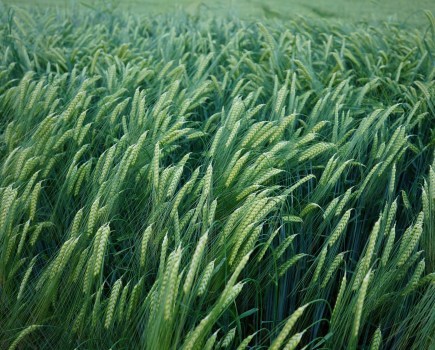
When it comes to making any N adjustments to fertiliser programmes, it’s important to identify factors that could limit yield. CPM catches up on exclusive analysis of big data on the nutritional status of our soil and crops.
Changes to RB209 introduce an N-adjustment factor for expected yield, but any increase in nitrogen rate has to be justifiable. Keeping tabs on the nutritional status of soil and crops can help early identification of any factors that could limit the crop from reaching its full yield potential, says Jon Telfer, development management at Yara Analytical Services.
He believes that lessons can be learned from looking at Yara’s ‘big data’, which reveals there’s plenty of scope for improving on some of these potentially limiting factors at a nutritional level.

Jon Telfer says that their big data set shows nutritional limiting factors are widespread.
“We’ve been performing analysis of soil, tissue and organic manures for over 40 years in our lab in Pocklington and collecting data electronically since 1995,” says Jon Telfer. “This has given us over 20M data points to analyse and learn from, enabling us to provide insight for farmers. Our dataset from 2010-2016 certainly shows that limiting factors are widespread, but variable – making soil testing and analysis on individual farms essential.”
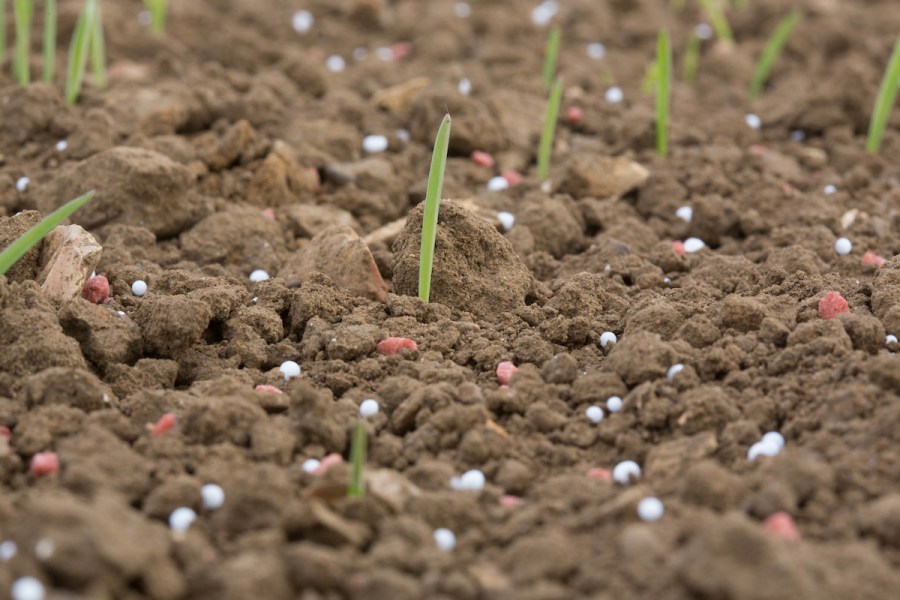
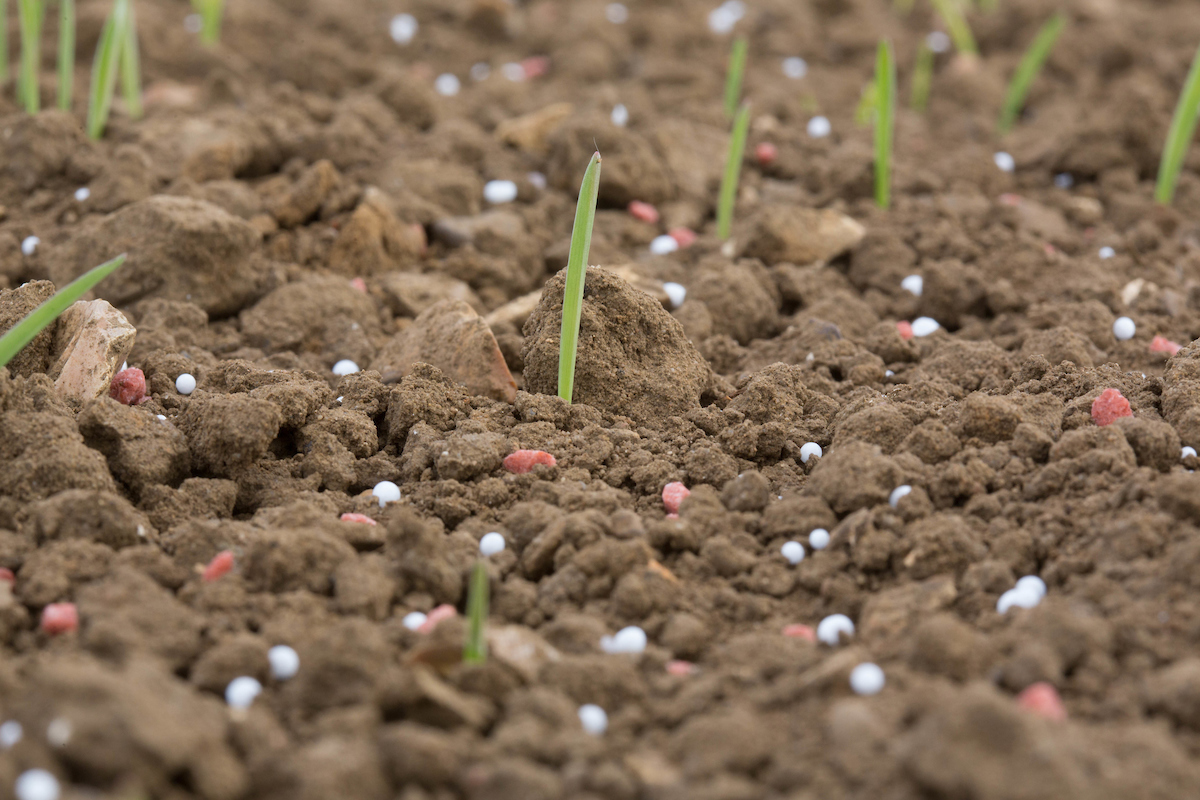
Furthermore, the earlier these limiting factors can be discovered and addressed, the better the outcome in terms of yield and productivity, he points out.
Limiting factors can range from soil conditions, soil fertility, disease and weed pressure to a shortage of other key crop nutrients.
Soil fertility is key and rather than guessing, factors such as soil type, texture and biological fertility can be measured, including organic matter (OM) analysis. Chemical fertility and identifying gaps in a soil’s status and performance is where soil analysis really comes into its own, believes Jon Telfer.
“It provides an opportunity to identify the factors that are going to hold back yield. Crops need a variety of nutrients to complete the growing process – both macro and micro-nutrients – and a deficiency of any single one is enough to limit yield.”
Lessons from the data set
So, with this in mind, what does Yara’s data set tell us about potential nutritional limiting factors? Jon Telfer says the first thing it highlights is soil pH.
“We know that having the right soil pH, between 6.5 and 7.5, is vital for utilising the nutrients that exist within our soils. However, our data for UK arable soils shows that of the 500,000 soils processed, almost half needed some form of pH management, with 20% having a pH of less than 6 which is likely to impact on NPK usage efficiency. Making sure your pH is right must be the starting point.”
Low levels of available phosphorous and potassium are also known to limit yields and the effectiveness of N applications.
Need for N may be less than you think if other nutrients aren’t available.
“Our data shows that a quarter of arable soils tested in the UK are at potentially yield-inhibiting levels of phosphorous deficiency, with over half of UK soils needing phosphorus management – that’s building-up or replacing what we’re removing after offtake by crops,″ says Jon Telfer, stressing that phosphorus availability also needs to be taken into account as well as soil indices.
Similarly, a third of soils have potentially yield inhibiting (index 0 or 1) levels of potassium, with over half requiring potassium management.
Sulphur reserves exhausted
In 1995, 63% of soils analysed were below Yara guidelines for plant-available sulphur but this has been on a downward slide ever since.
“That figure is now 96-97%. We can safely say that reserves of sulphur are exhausted, hence why it’s now considered a major nutrient alongside N, P and K,” he explains.
Whilst N, P, K, S and Mg are the major nutrients, plants require a whole range of nutrients for different functions and a deficiency in any of them is enough to limit yield.
“Looking at our big data, only 13.5% of UK soils had adequate pH and nutrients (including manganese, copper and zinc) for a healthy winter wheat crop. This means that if you invest in soil analysis, seven times out of eight you’ll identify potential opportunities to improve yield and productivity. The same was true for oilseed rape soil: by including manganese, boron and calcium, only 7% of soils were found ‘fit for purpose’.”
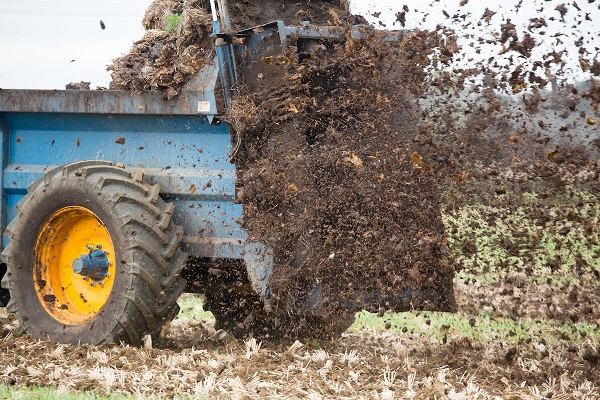
How much are organic manures contributing to nutrition?
Another area where the big data set offers insight is the value of organic inputs. When it comes to assessing the contribution made by organic matter, it’s tempting to use the standard values for any given manure in RB209. But just how accurate are the given book values?
Analysis shows that whilst accurate measurements of nitrogen and phosphate are variable, they do hover around the book value in RB209. But when it comes to levels of potassium, there’s a discrepancy between RB209 and Yara big data, reveals Jon Telfer.
“Potassium measurements going back to 2005 never matched the value stated in RB209. So if we rely on these book values to populate our nutrient management plans we could be building in inaccuracies. It’s better to test and use accurate figures,″ recommends Jon Telfer.
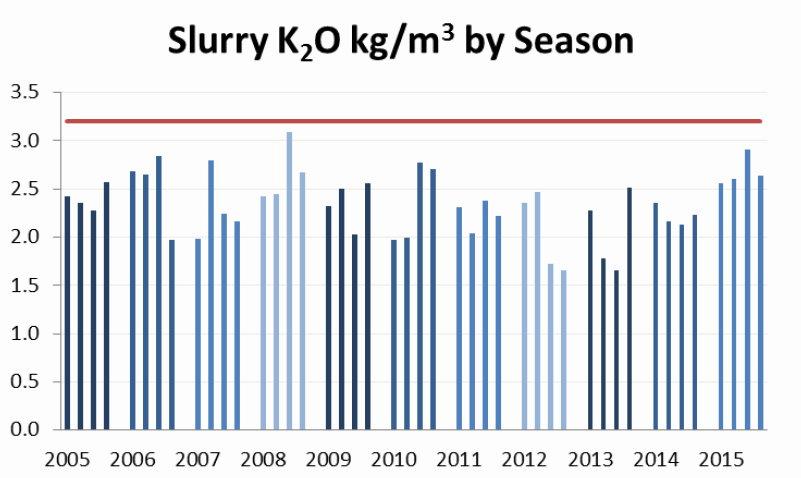
Source: Yara big data
Inside the plant
“Leaf testing is the most effective way of monitoring actual nutrient uptake. It gives you the opportunity to identify deficiencies before they become chronic and show themselves as visible symptoms. Over half of the winter wheat tissue samples processed through the lab between Jan and June 2016 were deficient, not just in one but in multiple micro-nutrients.”
86.7% of samples were deficient in at least one key micronutrient, zinc, copper or manganese, and 57.3% had two or more key micronutrient deficiencies, he adds.
Yara’s big data set confirms that UK arable farmers are confronted by a wide range of potential limiting factors, but this also presents many opportunities. Farmers can identify and correct limiting factors before they start nutrient programmes, suggests Jon Telfer.
“Testing early gives the opportunity to correct any deficiencies, or combination of deficiencies, through the tank before the plant has reached a point of stress from which there’s often no return. As an example, our data on P, K and S deficiency confirms that many farmers will certainly find their need for straight N is far less than they thought and opting for NPK or S and NS fertilisers instead may be to their advantage.
“In cereal crop trials the use of NS fertiliser has led to yield increases of 0.3t/ha, whilst in OSR this has been higher at 0.5t/ha. Using a granulated NS product will result in an ROI of £2-10 for every £1 invested.”
“Similarly switching a first spring application to a ‘spring starter’, NPKS complex compound fertiliser, will give arable crops the best possible start in the spring as they look to recover root and shoot growth lost over the winter. Research into this approach has shown a consistent yield increase of a further 0.25-0.3t/ha, above the expected sulphur response,” he adds.