 Shrops grower Andrew Williamson has spent the best part of two decades on a quest to understand the variability of his soils. CPM visits to find out how this interplays with split-field trials.
You need to be able to compare light land areas on one side with similar soil on the other.
By Tom Allen-Stevens
Andrew Williamson drives out across the stubble to illustrate the undulation of the field. The farm pick-up climbs to the top of the ridge, then falls away sharply in a similar fashion to the first dip of a roller-coaster ride.
“You can sometimes have a job getting the combine up here,” he says. “It’s the topography of these fields, as well as the shading near the field edges, that’s largely responsible for the variability that shows up in the yield maps.”
The soil type Andrew farms at Upper Overton Farm near Bridgnorth, Shrops, is a medium silty clay loam. The land rises to 200m above sea level, with lower parts at around 100m. But it’s the undulation within the fields that’s caught his attention, and for many years he’s pursued ways in which to assess and address the in-field variability this causes.
It’s also brought him to BASF’s Real Results Circle – Andrew is one of 50 growers taking part in on-farm trials, putting two fungicide regimes side by side and sharing results to find out what really works in the field. He’s deliberately chosen a field that has a fair amount of variability, and has been gathering data throughout the season to assess the effect on the crop.
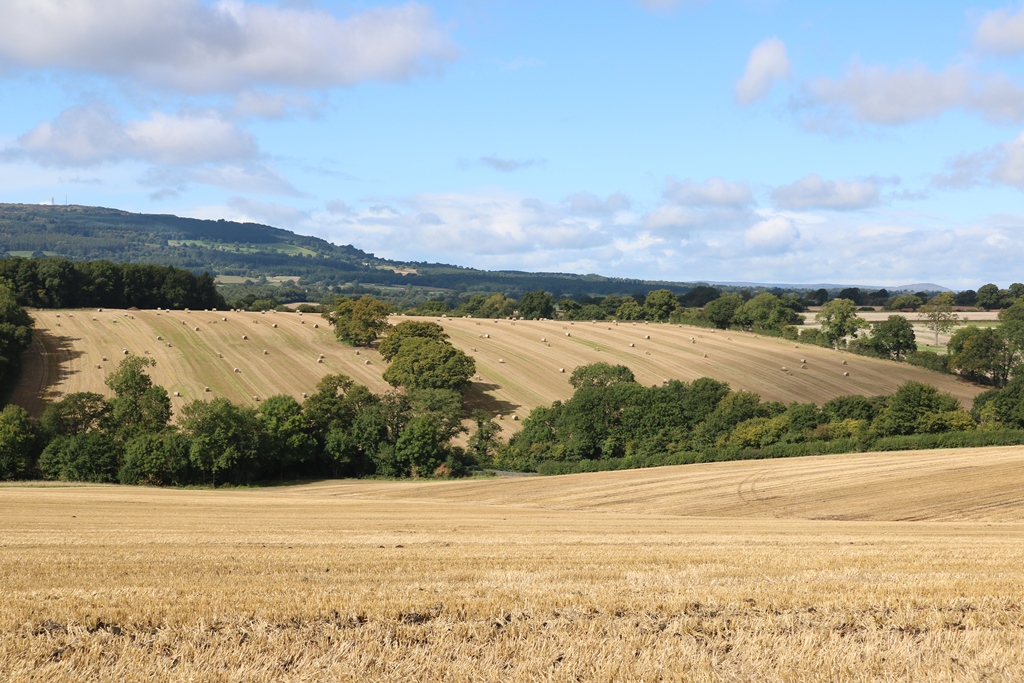
The undulation within the fields at Upper Overton Farm causes considerable in-field variability.
“I’ve always had an interest in technology and was keen to apply this to fertiliser inputs,” he recalls. “It was following a visit to Cereals in 2007, when I came across the N-Sensor and met Clive Blacker of Precision Decisions, that I really began to explore the variability in our own fields. At the time, fertiliser prices, especially TSP, were going through the roof, so we started to variably apply fertiliser.”
In 2007, the business, Beddoes and Williamson, took on extra land, and the arable cropping area leapt from 120ha to 320ha. “We took the decision the following year to crop everything and yield-map everything, with a view to identifying unproductive areas and putting them into Higher Level Stewardship,” he explains.
“The variability was massive, and it really brought it home once we put figures on the differences we saw. Areas we ear-marked to take out of production were truly awful – even if we’d sold the crop at the best price, every tonne we harvested from those areas was costing us just to put it in the shed.”
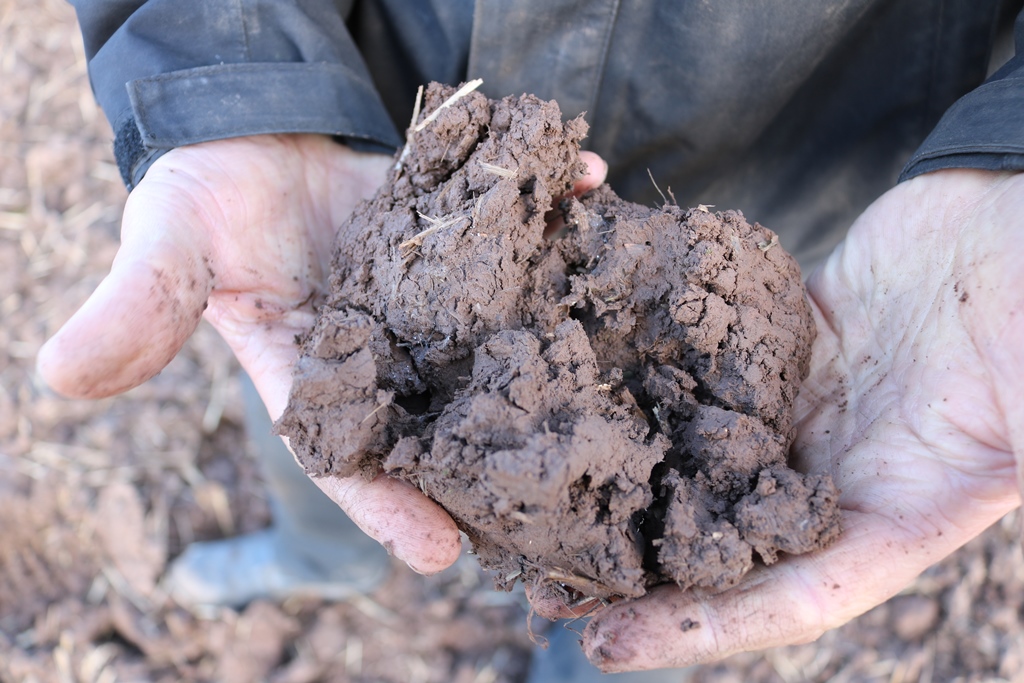
Farming a medium silty clay loam, there’s in-field variability in soil type, but yield variation isn’t all down to soil type or nutrient index.
This informed what areas were taken out of production and put into HLS to receive the relevant payments, while crop production was focused on more profitable parts of the fields. But Andrew’s quest for answers wasn’t over.
“The yield maps gave us chapter and verse on crop performance, but interestingly, when you look for reasons behind it, the variability wasn’t all down to soil type or nutrient index.”
Fields were divided into zones according to areas with high, average and poor yields, and these were then sampled. “In most areas there was no direct correlation with nutrient index.”
With the knowledge that yield variability was not related to nutrient index, this helped Andrew produce major nutrient application maps based on offtake. “Nutrient index doesn’t tell you availability – it was fairly clear soil type was holding crops back. So we started looking at electrical conductivity scans.”
These give an indication of soil type and how this varies across a field. At the same time, he’d been using the N-Sensor to gather data throughout the season on crop growth. “The EC scans help you manipulate seed rate. So you drill a higher seed rate where there’s a high clay content. But you have to be bold to get results, and alter rates by at least +/- 20%. We put more than double the rate on some areas compared with others.”
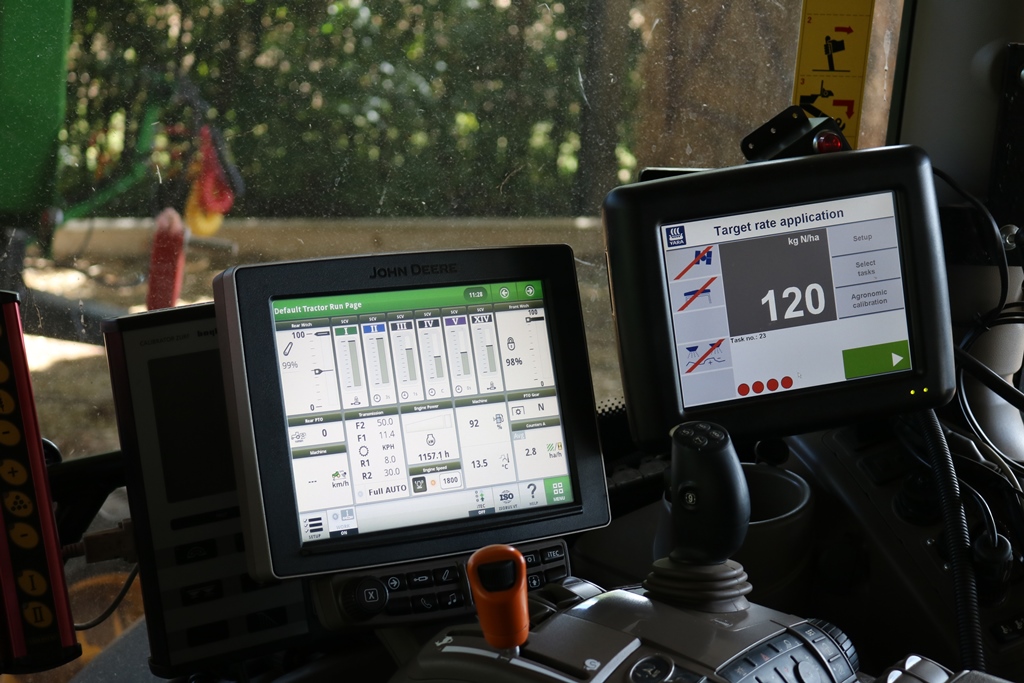
The N-Sensor has been used both to variably apply fertiliser and to gather data throughout the season on crop growth.
As he developed the system, he was gathering more data about the crops and his soils. The value here was not in manipulating inputs, however, but in understanding the variability within his fields. “One aspect that became increasingly apparent was that north-facing and shaded areas consistently produce poorer yields. There’s not much you can do about that,” he notes. But he was convinced the data from these areas, linked with the knowledge of their topography, still had value.
“By this stage, I’d already done quite a bit with precision agriculture (PA) and had gathered a fair amount of data. But I wanted to find out how it could work harder for you and to truly realise the technology’s full potential.”
Nuffield Farming Scholarship
In 2012, he was awarded a Nuffield Farming Scholarship Trust travel award to put his quest on a global footing. He visited Canada, USA, Mexico, Germany, New Zealand, Australia and Brazil, finding out how precision pioneers in other countries were using the technology, and what lessons he could bring home.
“What I found is that throughout the world, most variability is related to the soil. But the key is to understand that variability and to bring all the information you have together to identify solutions, and then monitor results.”
Among farmers he visited was current world wheat yield record holder Eric Watson, near Canterbury, New Zealand. “He irrigates 96% of his 490ha, but has introduced a system of variable-rate irrigation that has removed 8ha of overlap between irrigators and he’s seen water savings of 20%.”
He also met with Andrew Smart of Precision Cropping Technologies in Australia. “Andrew stresses he’s in the business of Precision Ag, not Picture Ag – the value of data you gather is not in owning it, but in analysing it. So you can realise true benefits from PA by combining your knowledge of farming and your land with the skills of those who understand data and can use software to identify trends.”
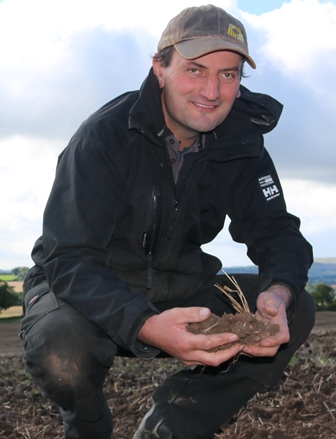
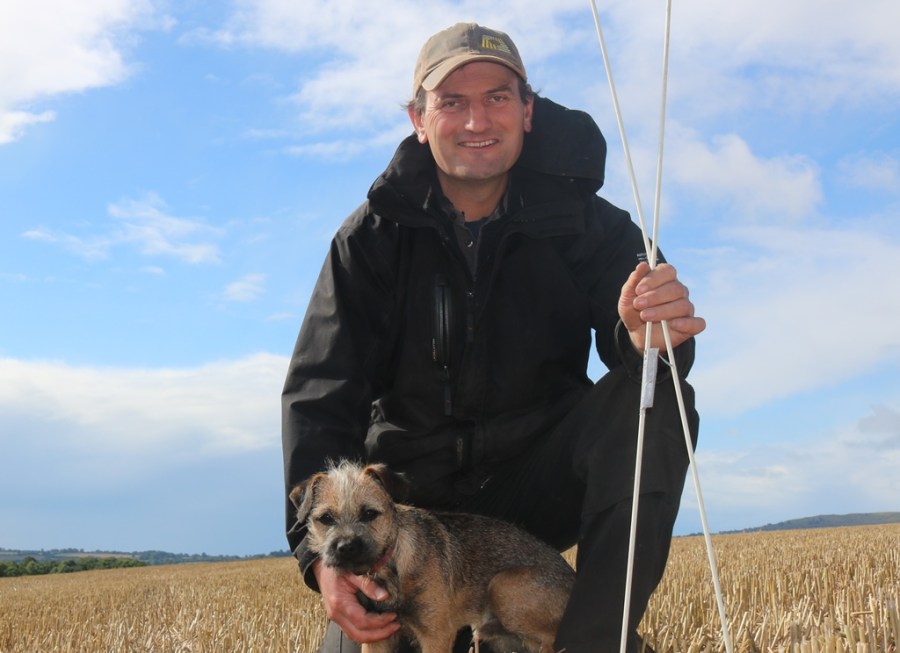
The biggest problem in assessing the benefit from a particular trial is getting a fair and true comparison, in the real world, says Andrew Williamson.
But one element that remained beyond his grasp was how to use the data collected to quantify the gains from PA. “The biggest problem in assessing the benefit from a particular trial is getting a fair and true comparison, in the real world,” notes Andrew Williamson.
“If a split-field trial looking at comparing variable-rate nitrogen to a flat-rate application is conducted, how can you be sure that nitrogen is affecting the yield outcome and not some other underlying variability? Much of the difficulty lies in the lack of ability to analyse the data accurately and drill down to see what the limiting factor is.”
He’s convinced you have to be able to compare many layers of data with each other, all at the same time, to be able to find the limiting factor. “By using statistical analysis, it’s possible to identify trends and measure the degree of variability,” he concludes.
He’s also convinced that farmers who can master their data will decide their destiny. “Data is king – how it is collected, interpreted, utilised and who owns it. Data management has to be simple, intuitive and freely available across all devices, from in-cab controllers to a smartphone in a farmer’s pocket.
“I think the use of tablets, apps and bluetooth links will supersede ISOBUS controllers and will go a long way to solving the compatibility problems farmers encounter. This will make the technology far more accessible and pave the way to deriving greater value from the data you generate.”
Data analysis driven by differences
The name of the 27ha field used for the Real Results trial – Sandpits – suggests it has a history that’s likely to colour how the crop performs. It’s relatively sandy, cropped with Revelation winter wheat following oilseed rape.
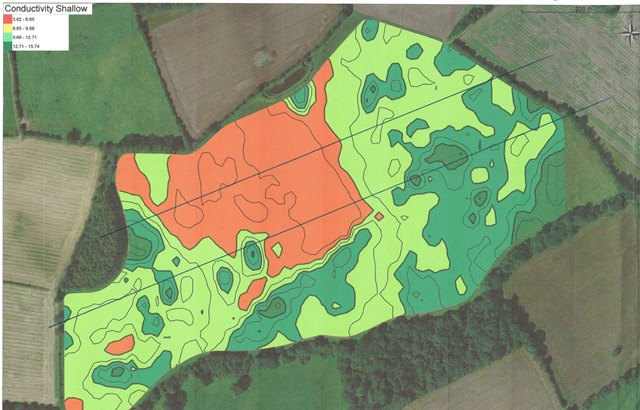
But an EC scan (see picture below) shows up a significant area of lighter soil, coinciding with the field’s steep undulations. Either side lie heavier areas, and the two tramlines under scrutiny cut straight through this variable progression.
 “We drilled the field on 20 Sept, and the seed rate was varied from 280-450 seeds/m². That’s not just tickling the rate but pushing the variation a long way. Nor is it just soil type that decides the rate, but also grassweeds – this field has some bad patches of brome,” notes Andrew.
But these circumstances bring out what he believes are the real value in on-farm trials. “Anyone can go and look at perfectly manicured trials sites, but farmers work in the real world. There’s value in doing a trial yourself under your own management.
“There’s also value in sharing your experiences with other farmers doing similar trials. It’s surprising just how time-consuming a tramline trial can be, but you’ve got to do it properly, and there’s a huge knowledge gain to be had if you do.”
He’s been keeping a close check on crop development using his N-Sensor, and distinct differences have shown up during the season. “Towards the end of the season, the crop on the lighter land went off a bit quicker than where the soil was heavier.
“That throws up a limitation of the classic strip trial over a weighbridge – it’s not really good enough,” states Andrew. “You need to be able to compare light land areas on one side with similar soil on the other, and then do the same with medium and heavy areas.”
That’s exactly what the trial is doing, says Vince Gillingham of AgSpace, the precision farming partner in Real Results. “For each site, we’re using an EC scan, if available, or soil brightness data to understand that variation. That informed where the trial went in the field in the first place, and the data will help ADAS analyse the results so we’ll be able to cut out the background noise and compare like with like. That will give us a true picture of the trial’s performance.”
As well as the initial soil scan, the crop growth has been monitored by AgSpace over the growing season, using the company’s algorithms, based on satellite images to get 12-15 scans of each trial. This data has been made available via an online platform for both ADAS and individual farmers to help with assessing the trial. “It’s also helped us highlight any anomalies, such as pest damage, that should be taken into account,” adds Vince.
So with the field now harvested, how have the two programmes fared? Andrew’s keeping tight-lipped on results. “There was a difference, and I was quite surprised, but I’m reserving judgement until the data’s been analysed fully. The true value in this trial will be to drill down through the data points and do some statistical analysis. I think that will tell me as much about my soils as the products I’ve used on the crops.”
Upper Overton’s Real Results trial
| Timing | Upper Overton Farm | BASF |
| T1 | Aviator (1 l/ha) + CTL | Adexar (1 l/ha) + CTL |
| T2 | Ascra (1.2 l/ha) CTL | Librax (1.25 l/ha) + CTL |
Both plots received a T0 spray of chlorothalonil and a T3 of tebuconazole; Adexar contains fluxapyroxad+ epoxiconazole; Ascra contains bixafen+ fluopyram+ prothioconazole; Aviator contains bixafen+ prothioconazole; Librax contains fluxapyroxad+ metconazole.
The Real Results Circle
Farming in the UK has never before been confronted with such a perfect storm of uncertainty.
Uncertainty over where the industry is headed post Brexit; uncertainty of returns, because of fluctuating prices and stagnating yields; uncertainty over the removal of chemical active ingredients from the arable toolkit, and uncertainty over which of the mind-boggling array of new products, technologies and tools would be best to try to get to grips with.
To combat growing uncertainty, BASF and CPM are encouraging everyone with a passion for UK farming to unite. We want to help form an agricultural knowledge network of experts, industry specialists, agronomists and farmers.
We want farmers to share their knowledge and conduct on-farm trials. By coming together to face challenges as one, we can find out what really works and shape the future of UK agriculture.
This year, BASF’s Real Results Circle is exploring wheat fungicides and oilseed rape profitability. This series of articles in CPM profiles some of the growers who’ve joined the Real Results Circle, giving an insight into how they optimise returns from their crops. We’ll also have topical advice and expert guidance from ADAS on how to get the best from on-farm trials.
To keep in touch with the progress of these growers and the trials, go to www.basfrealresults.co.uk