Growers from BASF’s Real Results Circle gathered recently to receive the results of the first scientifically robust set of on-farm line trials. CPM joined them and exclusively reveals what these were.
It’s a shared endeavour, involving researchers and scientists working with farmers.
Tom Allen-Stevens
Using BASF’s Xemium SDHI fungicides at the T1 and T2 spray timings delivers a benefit over competitor products in 71% of cases according to the Real Results from 50 on-farm trials conducted over the past year. But only seven of the trials gave a scientifically significant result, following analysis using the ground-breaking Agronōmics technique developed by ADAS.
Fifty growers across the UK took part in the trials in which a T1 spray of Adexar (fluxapyroxad+ epoxiconazole) and a T2 of Librax
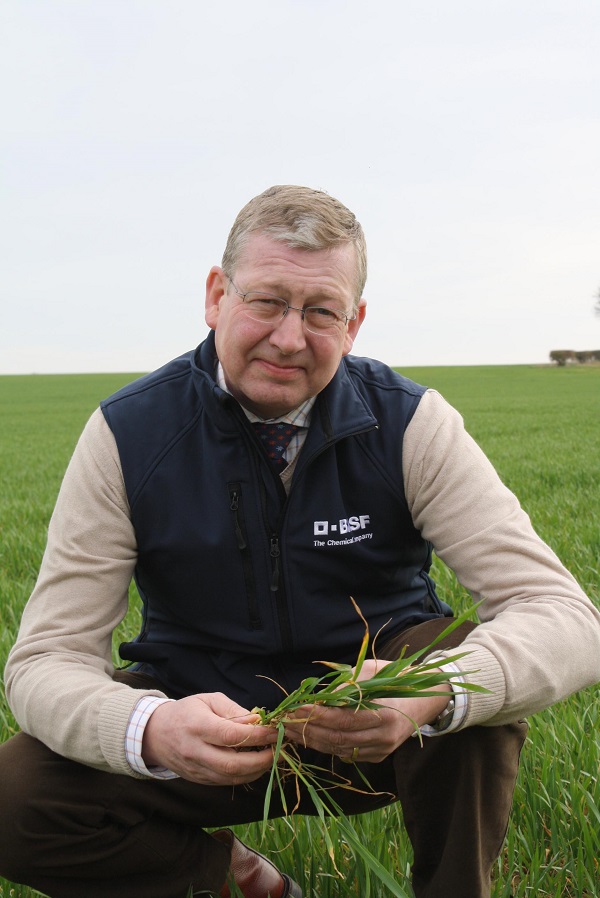
Ben Freer wanted to know whether results from small-plot trials would translate into real results in the field.
(fluxapyroxad+ metconazole) were tested against an equivalent competitor programme with new-to-market SDHIs chosen by the individual growers. “Over the past three years, 113 comparisons have shown an average 0.2t/ha advantage for Adexar over Aviator (bixafen+ prothioconazole), with 61% showing a positive result for Adexar,” explains BASF’s Ben Freer.
“But these were small-plot trials. We wanted to know whether they would translate into real results in the field, in real commercial situations.”
The difficulty with such comparisons, however, is achieving a result that’s statistically robust. “There’s a lot of background variation in the field that can mask the effect of a fungicide. But Agronōmics turns that on its head and has given us some real results.”
The overall results are a draw, reports Ben. “We received harvest data from 40 growers. For 18 of these, the BASF Ad/Lib programme produced a positive result, averaging 0.52t/ha. But 22 growers achieved a better result from the competitor programme, averaging 0.41t/ha difference.”
In 22 of the results, yields were measured over a weighbridge. “This gives you just one result per trial. Again it was even Stevens, with 10 favouring Ad/Lib, averaging a 0.64t/ha advantage, and 12 results going the other way, averaging 0.38t/ha. But how much confidence can we have from weighbridge results that the difference is down to the fungicide?”
What’s unique about the Real Results trials is the approach taken. The sites were earmarked at the start of the season, with satellite-derived assessments of soil brightness and crop growth undertaken by AgSpace. Assessments were also made of various YEN (Yield Enhancement Network) criteria, such as ear numbers, spikelets, biomass, harvest index and grain N offtake.
So could these explain the differences? “There was no pattern linking the results to yield components, although using this approach to help explain individual results has proved useful,” notes Ben.
In 18 of the trials, yield map results were available, and this is where Agronōmics has stepped in. “Agronōmics is the science of field-scale farming,” explains Dr Daniel Kindred of ADAS.
“It’s for developing and testing innovations and best practice, and it’s a shared endeavour, involving researchers and scientists working with the farmers hosting the trials.”
Agronōmics analysis of 2017 Real Results trials
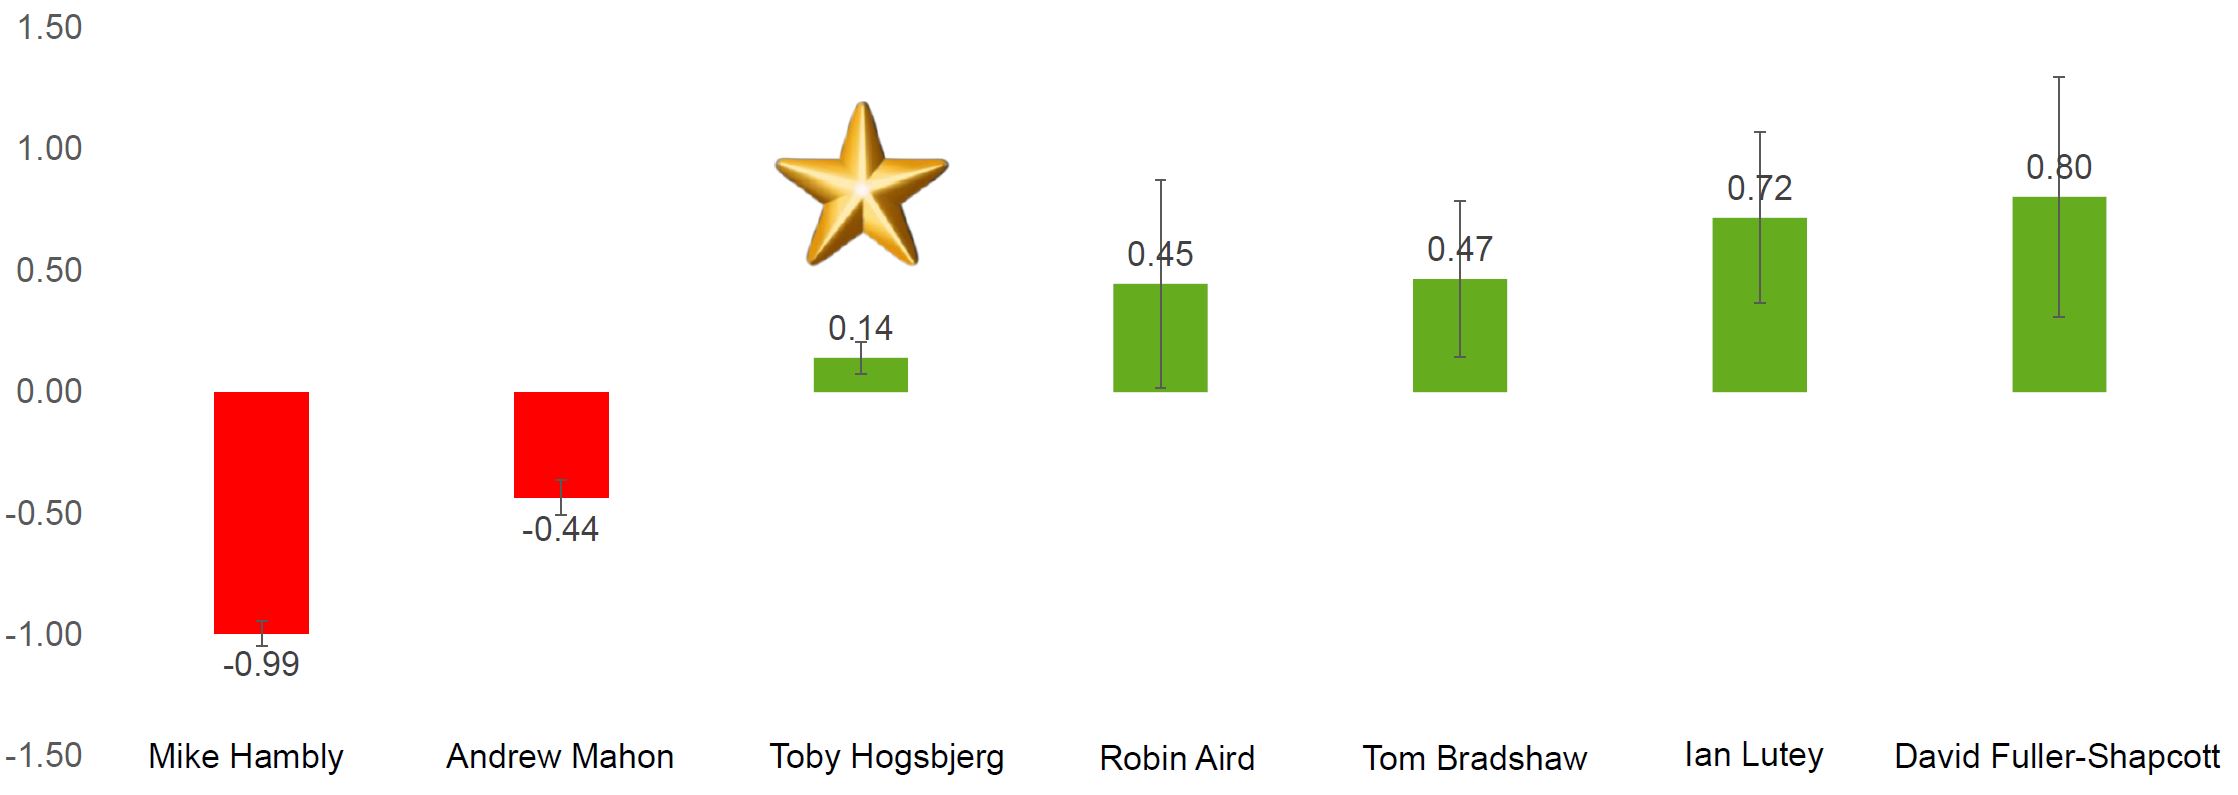
Source: ADAS; LSD shown as whiskers, p (confidence)=>90%
Field-crop research has guided on-farm decision making ever since the Broadbalk experiment at Rothamsted started in 1843, he notes. “These are small-plot trials with each plot covering around 50m². But the results are scaled up for advice over millions of ha.”
That puts the focus on the reliability of the data – scientists look for a least significant difference (LSD) to ensure the result from the trial is the effect of the criteria under scrutiny, and not some random variation. Typically, for a single plot trial, this will be 0.3-0.5t/ha or around £50/ha. “But field-based decisions may be based on differences of less than £10/ha. Just because there’s no significance, it doesn’t mean there’s no economic effect,” he reasons.
So trials are replicated which has the effect of reducing the LSD and improving the confidence the scientist has in the data. “But this approach is expensive and tells you little about soil effects and interactions.”
What’s moved the science on is the ability to gather data from multiple sensors and obtain spatial information using GPS. But there’s still the challenge of harnessing this big data. “It’s estimated there are some 1030 decision combinations in arable farming, but the UK has only one million fields. So we can’t test every scenario and still need controlled experiments and scientific interpretation.”
While both scientific research and on-farm practical tests have similarities in terms of their concepts, metrics and tests, there’s a disconnect, Dan explains. “Scientists have laws and models, working on a small scale with biophysical metrics and need 95% certainty for proof of concept. On farm, it comes down to experience, rationalising commercial metrics on a field scale, where greater than 50% certainty is good enough evidence.”
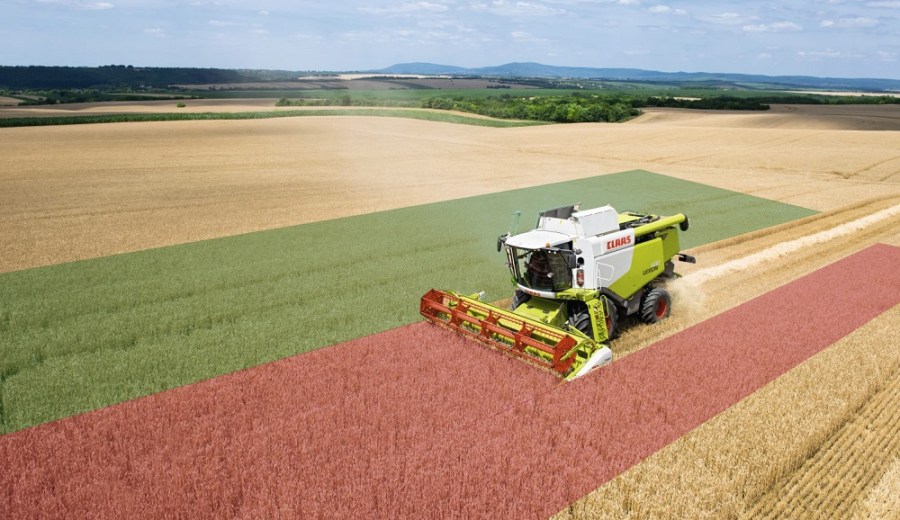
On a field scale, on-the-line comparisons are often the most compelling – where two different treatments meet, a visual assessment of the difference can be decisive. But it’s qualitative – measurements are rarely made nor can they be analysed statistically. “Can we formalise or digitise this comparison?”
Typical yield maps are often inadequate for scientific comparisons, however, and in-field variation can be huge, he points out. Perhaps the most striking example was the industry-funded Auto-N project in which various N rates were applied in a ‘chessboard’ trial to study the variation in optimum N. “We saw in-field yield variations of 3-4t/ha – clearly N is not the main driver of yield variation.”
This led to the Agronōmics project – an ADAS investment with BASF, AgSpace, British Geological Survey (BGS) as partners and support from Innovate UK – to develop the ‘line-trial’ experimental technique which takes into account soil variation. Whereas a small plot trial typically has only a few replicates of each treatment, yield map data typically gives over 10,000 data points for a single field. A field-scale line trial therefore produces a vast amount of data that can be statistically analysed to give confidence levels.
Greatest confidence comes from having a dataset with as little underlying variation as possible. For the Real Results sites, that started with site selection, explains Susie Roques from ADAS. “We’re looking for a relatively homogenous area of a field, so used soil brightness and NDVI data from AgSpace to choose the treatment sites.”
When the yield data comes in, there’s a certain amount of cleaning to be done. “We take off headlands and end of runs. Areas that aren’t even shouldn’t be counted. The software picks up data points that are dramatically different, and an offset correction is applied.”
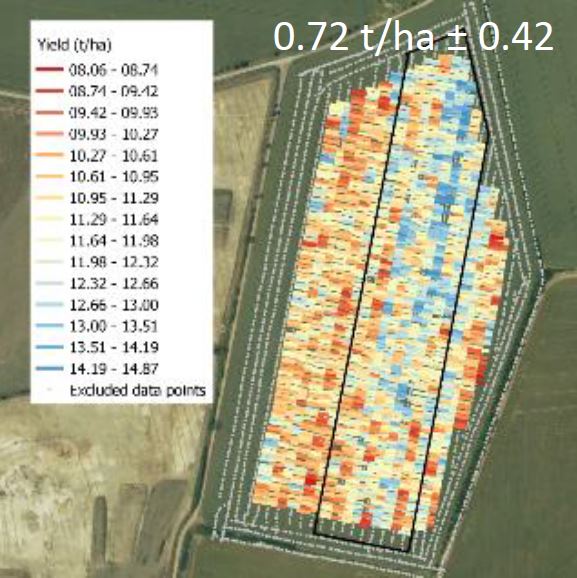
A yield map provides thousands of data points, which are statistically analysed with a model of underlying variation to build a real result.
Combine set-up and practice are also important. “The yield meter should be calibrated, and the combine header kept full – a part-width will skew the result. The combine must also run up to the treatment boundary, not straddle it. We also need to know of any areas of waterlogging or weeds.”
Once cleaned, the number-crunching begins, with comparison focused on the treatment boundaries – adjacent combine runs in contrasting treatments.
All growers have received back their data, with information on LSD and confidence. “Confidence gives you a measure of the accuracy of the trial, that the difference is actually a real one and not down to pure chance,” explains Ben.
“Traditionally, small-plot trials are assessed with a 95% confidence level – a lot of data can be thrown out, which can be quite depressing! Here, we’ve discarded all results with a confidence level below 90%.”
LSD is a measure of how big the difference between treatments needs to be if it is to be counted as real. Only seven out of the 18 yield-map results had a treatment difference which was significant at a confidence level above 90%, five of which favoured the BASF Ad/Lib programme.
David Fuller-Shapcott near Kelso in Scotland scored the highest difference for the Ad/Lib programme at 0.8t/ha, while for Mike Hambly in Cornwall this resulted in almost a 1t/ha disadvantage over the competitor products. By coincidence, the BASF programme was the farm standard for both growers.
“Statistically, Toby Hogsbjerg in the Cotswolds scored the star result – a very small difference that was real,” notes Ben.
The trials will continue next year with the Real Results farmers able to choose their fields. They’ll have had the experience of 2017, therefore giving us us even more ‘Real Results’ for 2018,” he concludes.