Initial results from a couple of projects are head-turning enough, but the technologies on test may be where the real interest lies. CPM reports.
What’ll be exciting is when we start to dig deeper into the genetic variation.
By Tom Allen-Stevens
This year’s spring drought may have brought about a potential yield loss in winter wheat of up to 34%. Meanwhile satellite mapping has revealed the UK cropped area of winter oilseed rape has dropped by 97,000ha over the past three years, with a 36% swing away from the crop in East Anglia.
These are not the results of surveys or guesstimates, but initial findings from two separate research projects that are each using new technologies to further understanding of cropping systems and crop performance.
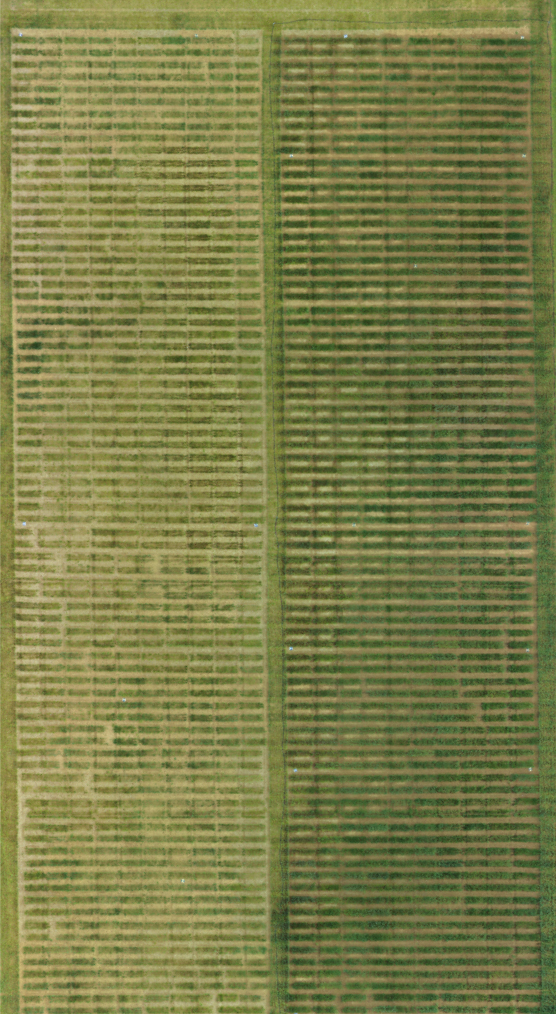
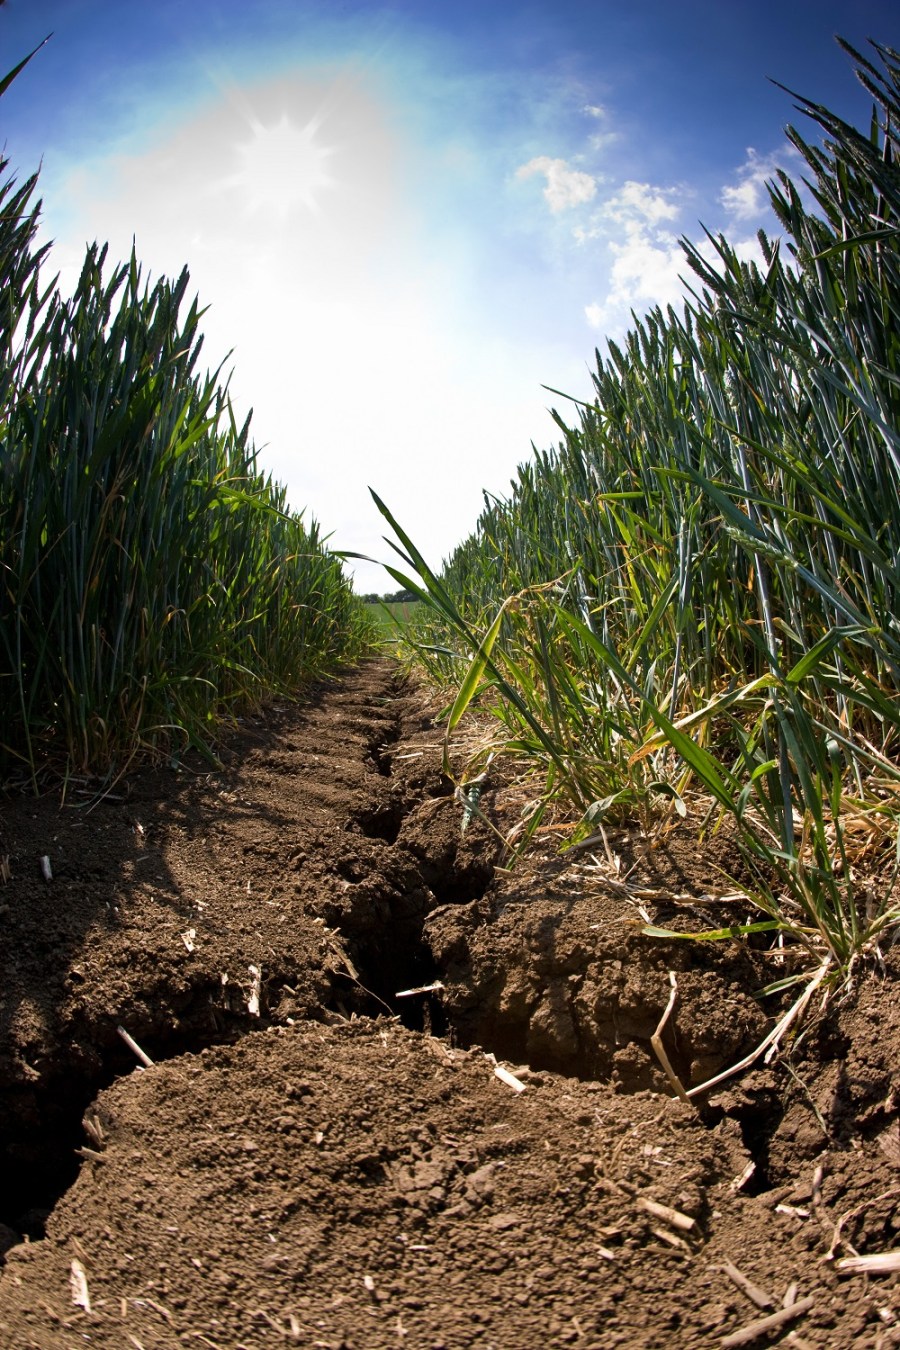
By 16 May, there were distinct differences between the rainfed (left) and irrigated areas, but there was also significant variation within the rainfed plots.
“It’s been a fairly average year overall for cropping performance, but we’re fully aware potential yield was hit by the lack of rainfall in April and May,” notes Prof Donal O’Sullivan of the University of Reading. “We may be staring accelerating climate change in the face, so there’s a need to get a grip on just what consequences weather extremes may have.”
Getting an accurate figure on yield loss caused by drought is the first step in finding solutions, but it’s remarkably difficult to do because true field comparisons can only be carried out in years when there’s been an actual drought effect. The opportunity to do so arose this year, however. “The gamble was whether we’d get under-average rainfall, and the gamble paid off – there was a six-week period from the end of March to mid May with virtually no rain.”
The project, funded by BBSRC and the Newton Fund, is looking in some detail at how genetic variability in wheat crops inter-relates with drought tolerance. A fairly drought-prone site in Berks – sandy loam on a gravel bed – was chosen and four replicates of 400 miniplots (0.5m by 2m) were established. Half of the plots were irrigated, while in the rest, nature was left to run its course.
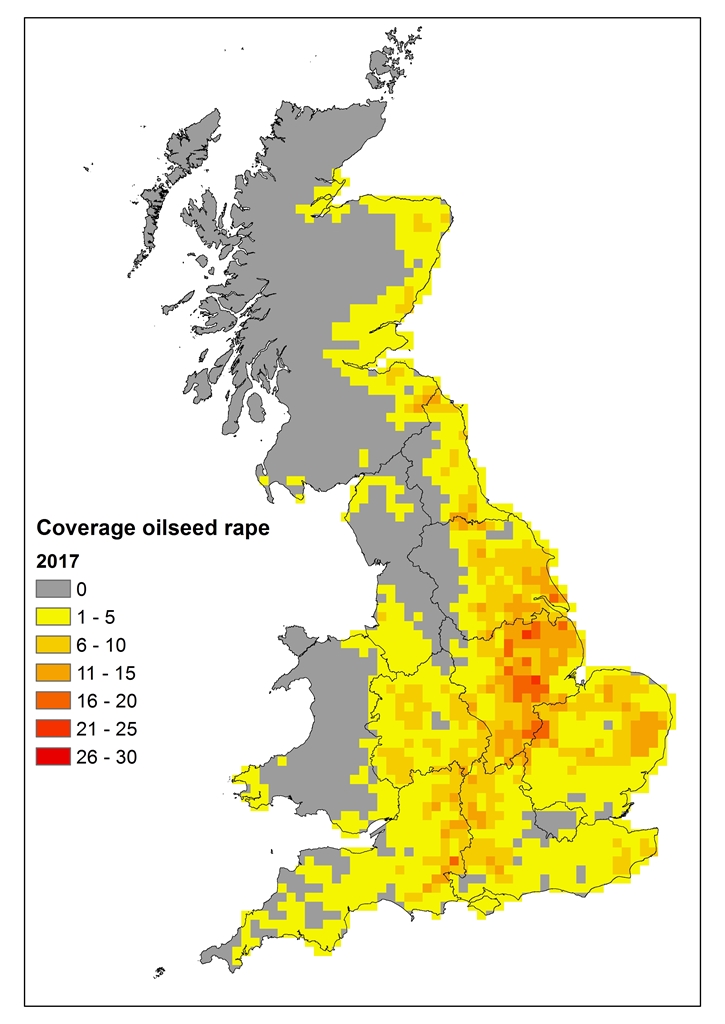
The latest maps generated from the Sentinel satellite data show the area of OSR in East Anglia has dropped by 36%.
“The harvest results are just in and the results are stark,” reveals Donal. “Our preliminary analysis indicates that this year’s drought caused a 34% average loss of potential yield.
“If losses at this level were observed across the 2M hectares of UK wheat crop, we’re talking about potentially 7-8M tonnes of lost yield. That makes the question of how to beat this magnitude of drought a billion-dollar question.”
And that turns the focus of attention on the detail behind this headline figure. The 400 different varieties are part of NIAB’s MAGIC population. These are wheats that have been bred by crossing eight commercial lines every which way to explore the genetic diversity and properties of the resulting progeny.
“We’ve already seen significant variation between plots, and there are a number whose yield is high whether on the droughted or irrigated treatments,” says Donal. “What’ll be exciting, though, is when we start to dig deeper into the genetic variation that may be linked with this response.
“We know drought tolerance is a multi-genic trait. The unique aspect about the MAGIC population is the lines are all inter-related. That gives us the statistical power to pick out the medium to small effects in quantitative traits. So while perhaps it won’t help us identify all the genes associated with drought tolerance, it’ll be the first time we’ve really been able to look at this aspect in detail.”
So how much do we know about how a wheat plant behaves when there’s a lack of water? “The effects can be quite acute in the latter half of April in the UK,” Donal explains.
“It’s when the plant develops the ear primordium. A little drought stress will prompt it to put its roots down further, which may actually help build yield later in the season. But if the period without water is prolonged, this is when the plant decides on its number of grain sites, so that puts a limit on the sink strength. It’s clear from the differences in our plots there’s a lot of variation in how a wheat plant determines this.”
It’ll take several months to pick through the data and identify some of the key genetic differences, says Donal. But it’s hoped it’ll result in genetic markers breeders can reliably use to build greater resilience into wheats of the future. “The advantage of using the MAGIC population is that this is genetic material that’s already in commercial plots – it’s simply a question of identifying the genes and selecting on that basis.”
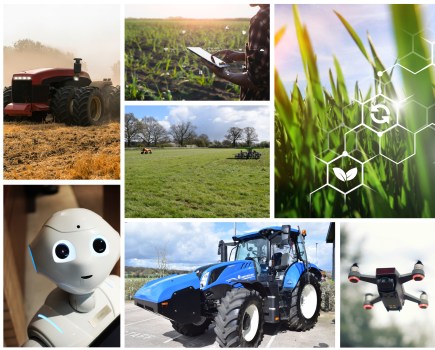
Technology of a very different type is being used to get an accurate picture on the evolution of cropping systems. And you may be surprised by just how much is already known about your cropped and uncropped areas, your rotation, and even what you’re probably planning to establish for 2018 harvest.
The latest Land Cover Plus Crops map produced by the Centre for Ecology and Hydrology (CEH) and Remote Sensing Applications Consultants (RSAC) has revealed for example an overall 15% reduction in the area of OSR grown across Britain over the past three years, the equivalent of 97,000 hectares.
The data is gathered as part of a NERC-funded project that uses data freely available from the two EU-funded Sentinel satellites. “CEH has been mapping land use across the UK since 1990, updating the results every 7-8 years,” explains CEH spatial ecologist John Redhead.
“For the past three years, we’ve collected this data using Sentinel-1, a radar satellite that constantly scans the Earth’s surface, and Sentinel-2, that sends back optical data. We process the two sets of data and these give us a very accurate, up-to-date picture of what crops are grown where.”
It’s not until relatively late in the season that different crops can be distinguished from the grids of numbers returned from the satellites. “OSR is always the first we can identify – it has a more distinctive canopy. Cereals are harder to tell apart, and it’s not really until harvest that we can process the data. With the data from the two Sentinel-satellites, we can now build a true sense of how the canopy changes over the season. It’s not just a snapshot, but a time series of land use and ground cover,” says John.
This means quite detailed and accurate models can be built up, not just on cropping area and land use, but a whole host of information on how ground cover develops. “We’re bringing together detailed ground surveys we have from other work and can relate it to the data gathered remotely. If you have good information on a field scale, you can work this up into a national picture.”
One application for this has been with Anglia Water to assess land use within Drinking Water Protection Zones, for example. But John believes the technology has huge potential to inform how cropping systems can evolve, and in particular to monitor wildlife habitats.
“We can use past data to build models of predicted cropping, for example. There’s also potential for monitoring crop health through a season and gauging the effect of arable management issues on the national crop.”
It can also help build a picture of pollinator habitats – an area in which CEH has considerable expertise. Recently published is some work CEH has led on looking at the effects of habitat composition and landscape structure on worker foraging distances and longer term survival of five bumble bee species.
“The main findings are that different species travel different distances, generally 300-500m, and that these distances vary with habitat. Where there’s a higher concentration of suitable foraging plants in flower, workers don’t have to travel as far, whereas in areas with fewer flowers in the landscape, workers can end up having to travel as far as almost 3km. There’s a knock-on effect of the quality of the habitat – if a bee has travelled a long distance to forage, it must be rewarded with plenty of suitable flowers when it gets there,” notes John.
Red clover is among favoured species, he adds, although it’s important there’s a good season-long supply of flowers. “This has a significant impact on the long-term viability of bee colonies. We’re hoping we can combine our knowledge on habitats and foraging activity with data gathered on cropping and landscape to build a picture of where pollinators thrive and where they may be at risk.”