Healthy area duration (HAD) can deliver robust data on the impact of disease. CPM explores the concept and how it’s unpicking some of the physiological effects associated with fungicides.
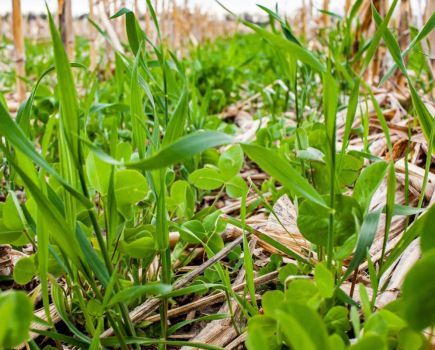
Septoria decreases source capacity by reducing green leaf area which can have a big impact on yield.
By Tom Allen-Stevens
The level of disease control achieved with a fungicide can be a subjective measurement. Walk into a set of plots on two different dates following treatment and you can draw slightly different conclusions about how effective the products on trial were.
“I have a bit of a bugbear about snapshots in time,” comments Julie Smith, principal research scientist in crop pathology at ADAS. “To properly understand the negative impact of disease on yield you need to account for canopy size and this requires a more robust methodology than a single assessment, at a particular point in time.”
There’s also the question of the additional effects of fungicides and how these are assessed. “I’m always sceptical of the supposedly ‘disease-free’ crop – every field in every season comes under attack from billions of spores and there’ll usually be septoria present in a winter wheat crop, even if it’s at a very low level. As a scientist, I need a model that allows me to unpick the effects in a real field situation,” she says.
Rather than look at a snapshot assessment, Julie prefers to study a disease progress curve over time, and instead of using the percentage infection at a single point, she calculates the area under the curve (AUDPC). “This helps to understand both the size of the effect and for how long it lasts but it’s still limited to the individual leaf level,” Julie explains.
To understand the impact on yield she notes that crops needs a balanced source:sink ratio to achieve their yield potential. “The source capacity of a crop during the critical yield-forming period is crudely a result of the amount of sunlight the canopy can absorb, the efficiency with which it can utilise the light energy during photosynthesis and the amount of stem reserves available for remobilisation. Conversely, sink (storage) capacity is influenced by the number of grain sites per ear, the number of ears per plant and potential grain weight.
“Over the past 25 years, plant breeders have done a remarkably good job of increasing sink capacity but parallel increases in source haven’t quite kept pace, which means that modern wheat varieties grown in the UK already tend towards source limitation. Septoria further decreases source capacity by reducing green leaf area (GLA) which can have a big impact on yield.”
Julie points out that it’s only when you work at the canopy level that you can assess the true impact on yield of disease and its control. “That’s because the top four leaves are all important contributors – it’s not just about the flag leaf.”
To assess these parameters, scientists measure healthy area duration (HAD). It’s not a new concept – they’ve been using HAD since the 1980s. For wheat in the UK, the model really came into its own in the late 1990s, following research led by Dr Rosie Bryson, while she was at ADAS.
“What the research team did was to develop a leaf-form factor and a standard methodology to measure the HAD values of wheat plots which puts real scientific rigour into assessing the performance of a crop canopy,” notes Julie.
The methodology involves calculating the green leaf area index (GLAI) for each of the top four leaves at regular intervals through the yield-forming period, plotting these on a chart, with the HAD value calculated as the area under the resulting curve. “It’s a combined measure of the size and duration of healthy green canopy – the higher the better,” she explains.
“The real benefit of this method is there’s a very strong correlation between HAD and yield – much stronger than with either disease % or GLA %. Accounting for canopy size removes a lot of the extraneous variation seen when working with %age disease severity and allows robust comparisons to be made across varieties, sites and seasons.”
The relationship is also linear in commercially representative wheat crops, Julie adds “The interesting point here is that it shows that more yield can be obtained if we can increase HAD – that could be through breeding, chemistry, agronomy, or a combination of all three.”
ADAS has used the HAD methodology with BASF to understand how its fungicide products are performing. “It’s an honest and unbiased approach because it captures the effect of the product through the whole period – from the time of application until canopy senescence – rather than just at one chosen point in time.”
It’s also helped scientists demonstrate the full extent of the decline in efficacy of azoles. When studied, older azoles are found to be limited both in terms of HAD and yield performance. But when Revysol was put under the same scrutiny, it had the effect of extending the line of the yield-on-HAD relationship, indicating an increase in the source capacity of the treated crop.
“This methodology has also helped us explore the physiological effects of products based on Xemium (fluxapyroxad). If a fungicide is doing something for a crop other than straight disease control, you get an uplift in yield per unit of HAD, so the line lies above a baseline fit,” Julie explains.
“The real strength of HAD is that it’s allowed us to carry out our research in a field environment because the HAD model can work with a diseased crop – you don’t have to resort to working in a controlled environment to obtain disease-free plants.”
HAD can’t give information on timings, such as when the best point would be to build GLA but it does allow for greater repeatability and therefore confidence in the results of a set of trials.
“But there is a final piece of the puzzle,” notes Julie. “This is the photosynthetically active radiation, i.e. sunlight, the canopy actually absorbs. That’s partly dependant on HAD and partly on how much solar radiation is available. We can’t control the amount of sunshine but we can measure it. By using a relationship known as Beer’s Law we can then calculate the cumulative solar radiation absorbed by the healthy canopy during the yield-forming period (HAA).”
While HAD has been used extensively across trials at ADAS to assess the performance of both Revysol and Xemium, BASF plans to make more use of techniques such as HAA to delve deeper into their properties, says cereal fungicides business development manager Dr Jon Helliwell.
“HAD relates closely to disease control, while HAA is more about the plant’s ability to capture light. That comes down to crop architecture and the interesting aspects are what you can do to manipulate that.”
Previous work carried out by ADAS has shown that Xemium has an effect on water-use efficiency, for example. “We’re starting work this year, taking HAD to a much more precise and detailed level to explore how we can manipulate the canopy to intercept more light. We’re also looking at the effect of co-formulations,” adds Jon.
Another exciting area, with scope for future work is looking at carbon capture. “HAD has potential to feed into carbon utilisation studies focussing on above and below ground processes. This may help inform carbon accreditation schemes as they’re introduced and give a more accurate idea of a growing crop’s contribution to climate change,” he concludes.
Near-perfect results from a ‘domino’ delve
With a greater focus on integrated pest management (IPM) comes the need for robust data to translate what it means on farm, notes Julie. “There’s a lot of talk about IPM, but when it comes to fungicide use and varietal disease resistance there’s little data that helps growers implement a sustainable strategy they can have confidence in. So we decided to take things to the next level in a HAD trial.”
Referred to as a ‘domino experiment’ due to the look of the plots in the field, three separate criteria were explored in a matrix of trials at ADAS Rosemaund in 2019. “We chose three commercial wheat varieties with differing resistance to septoria – KWS Santiago as one with a low disease score, less susceptible Hardwicke and Graham for its good agronomics,” she explains.
These were subjected to three different disease pressures: all plots were exposed to a natural infestation of septoria, then some of the plots were inoculated with field isolates while some were subjected to inoculation with DMI-adapted strains known to be less sensitive to older azole chemistry.
“Three different treatments were applied alongside untreated plots: full-rate Proline and then half and full rates of Revysol,” notes Julie. “Disease levels were high with untreated, naturally infested Santiago plots expressing 90% septoria on the flag leaf by mid-July.”
For each of the three disease scenarios, adding protection to the crop, either through variety or fungicide applied, resulted in improving returns. “It was interesting that when you track the epidemic and express the results in terms of HAD there was a benefit from applying Revysol even on a resistant variety under natural infestation. When disease pressure increased, or the population became less sensitive, the benefit from Revysol was greater,” notes Julie.
“The pattern of effects translated through to yield and the data presented a very elegant relationship between the treatments. The yield was comparable between untreated Graham and Santiago that received a full dose of Revysol. However, it’s not sensible to rely solely on resistant varieties to manage disease. We need to protect both our chemical and genetic resources from erosion and by using them in combination, each one helps to protect the other.”
CuraCrop results belie late season septoria surge
Monitoring of latent septoria in 2020 showed low levels of infection of crops at the flag leaf stage, reports Jon. “But disease levels ramped up towards the end of the season, showing the value of using a fungicide with longevity.”
CuraCrop is the system BASF uses to test for septoria infection in a wheat crop including in the latent phase – presence of the disease before symptoms start to show. Samples of the top three leaves are taken at the T2 spray timing and analysed for septoria DNA.
“Only 7% of those sampled at this timing showed any presence of septoria – significantly lower than previous years,” notes Jon. “But what’s really interesting is how the disease developed towards the end of the season.”
He points to a trial conducted by ADAS at Cardigan in S Wales. “Even 34 days after the T2 timing, infection of untreated crops was less than 6%. But by 52 days leaves one and two were 100% infected with septoria.
“It would have been interesting to have carried out a HAD analysis of crops in the trial. Leaves in the Revystar XE (mefentrifluconazole+ fluxapyroxad) treatment were just 12.3% infected at 52 days after treatment – about a quarter of the level of infection in the plots treated with Ascra (bixafen+ fluopyram+ prothioconazole),” he reports.
“Growers who changed their T2 strategy on the basis of low infection to products with lower longevity would not have achieved the potential of their crop,” Jon concludes.