The level of accuracy offered by precision agronomy platforms is accelerating rapidly. CPM takes a look at some of the options and functionality available.
It’s a small investment in what will always be the biggest asset on your farm.
By Charlotte Cunningham
Precision farming has become a widely accepted part of day-to-day practice, however, the level of accuracy demanded from the host platforms by growers and agronomist is increasing rapidly.
As such, precision technology – in particular, agronomy platforms – have had to level-up their offerings to arm growers with the level of detail they require to make complex farm business decisions.
Frontier’s precision farming division, SOYL, recently held a series of webinars, aimed at growers who are just starting – or in the early stages – of using precision crop production techniques in a bid to improve on-farm soil health and nutrition.
When it comes to precision nutrient management, Edward Jones – SOYL and sustainability knowledge exchange manager – says it’s not just about variable rate application. “Of course, this is a by-product of nutrient management and it has its benefits, but it goes beyond this.
“When we break it down, the dictionary describes precision as ‘the quality of being exact’ and I think that describes pretty well what we’re trying to achieve with precision nutrient management – we want to be exact with how we measure and record soil nutrient levels so that we can make better decisions on farm.”
As the industry comes under increased scrutiny from the government, the public and suppliers to be more efficient, being as exact as possible – in terms of soil assessment – is key, he adds. “More importantly is the repeatability of this – we want to be able to repeat these tests and come back to them year after year to monitor the progress.”
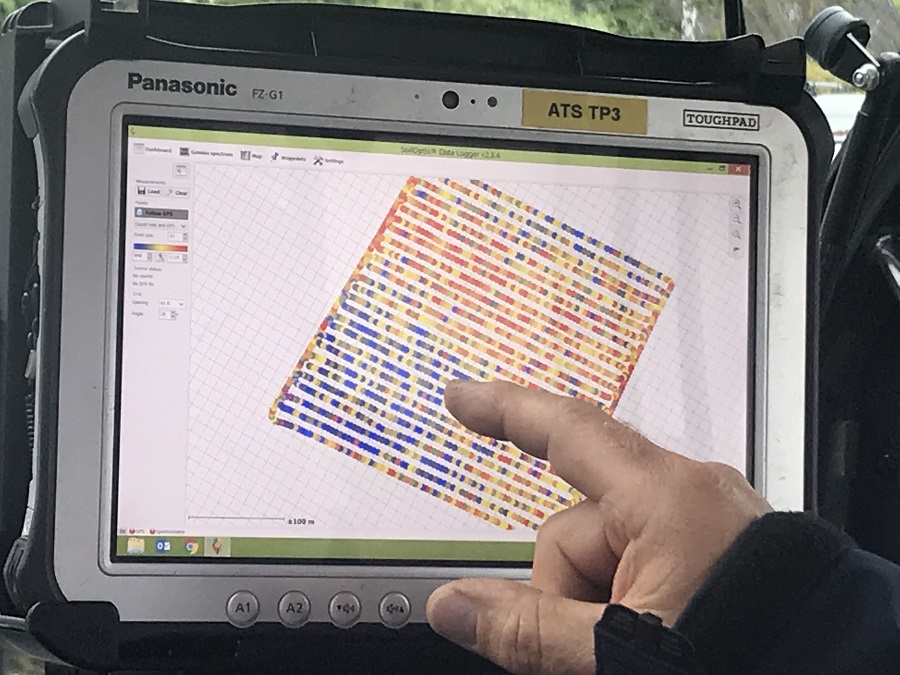
The SOYL platform presents soil plans and analysis visually, allowing growers to produce maps for phosphate, potash, magnesium, and pH, explains Edward. “In terms of that repeatability, the images also show exactly where the sample was taken from, meaning growers can return to the exact site and benchmark changes against this effectively.”
Looking briefly into the nuts and bolts of the system, SOYL works by using strategic sampling points based on a 1 ha grid, with GPS-mapped sample locations to allow replication, and 16 soil cores taken from each location to ensure accuracy.
Edwards says that nutrient mapping is a great way of illustrating variability – or consistency – on farm, but to get the most from it, it’s essential to keep an eye on the detail these maps reveal. “The devil really is in the detail here. For example, in one trial we did a W-pattern analysis for phosphate and potash which gave us indices of +2 and –2, respectively. However, when this was placed over a precision map created by SOYL, there was actually an awful lot of variation – ranging from 0-5 for phosphate.
“If a grower applied nutrients based on the W-pattern, they’d be either over or under supplying the crop, which is likely to have repercussions for crop production and ultimately, yield.”
Comparing accuracy levels, a W-pattern analysis is thought to be about 35% accurate, whereas precision mapping is around 75%, says Edward. “When we add in some strategic sampling points to a 1ha grid, this accuracy can be boosted to around 83% – it’s all about being as accurate and exact as you can to inform decision making.”
Not only does precision mapping give growers a baseline from which to measure success, but it also presents an opportunity to prioritise actions and inputs effectively – and potentially reduce them, he adds.
“We know payment by results is coming – and soil management is likely to be a part of that – so having a baseline will allow growers to closely and accurately monitor and prove their performance.
“We’ve found in our trials over the past 10-20 years that on average, there’s a £34/ha cost benefit when using variable applications.”
SOYL looked at this cost benefit in more detail in another trial comparing W-pattern sampling and precision nutrient management.
“The W-pattern analysis gave us a pH result of 5.9 and a subsequent lime recommendation of 106.75 t – resulting in a total cost of £2668.75. In comparison, the precision mapping showed a soil pH variation of between 5.8 and 6.9, meaning only 46.6 t of lime was needed.
“The total cost of this came in at £1165 – a difference of £1503.75 compared with traditional analysis.”
And while data-gathering is now very much a core principle of modern-day farming, using this strategically is going to be the biggest driver in improving production, believes Edward. “You can collect as much data as you want, but you have to be able to understand, interpret and use it in an effective way to get a benefit from it. That’s where the back up of experts, such as agronomists, comes in to enable growers to use it to benefit their business.
“It’s a lot harder to generate new soil than it is to maintain what you’ve already got – I’d really encourage growers to make what is a small investment in the grand scheme of things in what will always be the biggest asset on your farm.”
Looking to the season ahead, fellow agronomy firm, Hutchinsons, has several exciting developments in the pipeline, largely focused on its Omnia software. But the firm’s TerraMap also has some valuable functionality for growers wanting to do more in terms of soil mapping.
TerraMap was launched in 2019 and uses passive, gamma-ray detection technology to provide high-definition nutrient mapping, as well as information like soil texture, organic matter, CEC and plant available water.
The infield process of collecting the data is relatively simple and done in two steps: scanning, by driving a lightweight all-terrain vehicle fitted with the sensor over a field, and then taking soil samples to allow for each scan to be used to create the individual map layers. The entirely passive sensor measures naturally emitted isotopes, such as Caesium and Potassium, that are very stable due to their long half-lives, says the firm’s Nick Rainsley.
Perhaps rather interestingly, this methodology is not affected by soil moisture, compaction, crop cover or cultivation state, explains Oliver Wood, precision technology manager. “It means that there are very few limitations as to when TerraMap can be used – offering a much wider operating window compared to other soil scanning systems.”
According to Oliver, the consistency and reliability of the results have been well-proven. “We’ve taken satellite imagery of fields that showed up areas of soil differences quite clearly, and when we overlaid this with the texture maps created by TerraMap they were identical. This has been confirmed by in-field ground truthing across a number of sites. We’ve also tested the results between seasons and over different cultivations, and they have remained consistent.”
Looking at how useful it can be in the field, last spring, Hutchinsons looked at images taken from a drone flown over a field in Northumberland (where the firm conducts its regional trials) which identified an area that was a lighter green than the rest of the field – indicating poorer, thinner crop.
Lewis McKerrow, digital farming manager, was then able to use TerraMap to investigate what was causing the lower performance.
“We ran the scanner over the field – already mapped in Omnia – and, in one pass, had all the information we needed on the soils – all 21 layers. We then added into Omnia a satellite biomass (NDVI) map taken on the 8 May – there were clear areas of darker and lighter green, indicating areas of thicker and thinner crop, which correlated with the drone images. Over this we added in the sand layer measurements from the TerraMap scanning, as well as silt and clay maps.”
Lewis says the results were fascinating and completely correlated with the NDVI biomass map. “In the poorer performing areas of the field, there were higher levels of sand and silt and lower amounts of clay in the soil, and vice versa in the greener more productive part of the field.”
Working on the basis that soils with a high sand and silt content – and low clay content – tend to be drier, could it be proved that this was what was affecting crop growth in this area? In short, yes, says Lewis. “TerraMap provided us with a plant-available water map, and the results of this directly correlated with the soil texture maps, NDVI maps and drone images. There was more plant-available water in the higher clay percentage areas of the field, but where sand and silt were predominant, there was lower plant available water. So, we were able to confirm that the poorer performing areas of the field had less plant-available water.”
Turning focus to variable rate plans for seed and fertiliser, Rhiza has been making improvements to its platform, meaning growers can now make use of chlorophyll (GCVI) and soil brightness (SOB) imagery.
GCVI imagery estimates the leaf chlorophyll content by measuring the green light spectrum. It’s more sensitive to chlorophyll concentration than NDVI, sensing crop nitrogen levels to a greater degree, while identifying crop stress and senescence earlier. This makes GCVI particularly useful for late season variable rate applications, says Rhiza.
SOB imagery provides an assessment of soil variation by sensing the reflectance of bare soil. Soil variation defined by texture, organic matter and moisture can all be detected by SOB imagery.
Where crop establishment and yield variation are impacted by variation in these soil properties, seed rates can be adjusted and optimised for each soil type sensed in the SOB image, improving establishment, canopy management and yield.
According to the firm, the latest technology brings a number of benefits for growers and users including:
- The ability to tailor pre-harvest glyphosate using GCVI imagery to apply a higher rate where required.
- Creating seed plans in response to yield variation using GCVI imagery.
- Adjusting seed rates accordingly to soil variation using SOB imagery
- The opportunity to improve establishment and aid crop canopy management.
- Quick and easy creation of plans
Partnering for progress
As growers continue their quest for seamless two-way data transfer, last year SOYL and Muddy Boots announced a collaboration aimed at simplifying the use of data on farm.
As a result, field and cropping information can now be easily transferred from Muddy Boots’ farm management software, Greenlight Grower Management (GLGM), to MySOYL, a precision data tool within Frontier Agriculture’s farm management platform, MyFarm.
The new compatibility between the tools means that data relating to farms, fields, crops, and varieties stored in GLGM can easily be fed into MySOYL. “A continual challenge for UK farmers is to join up the digital systems they are using to reduce both the need for double-entry of information and the opportunity for errors when transferring data between systems” says Tom Parker, head of digital development for Frontier. “SOYL is constantly working alongside producers of external systems to improve the connectivity of our tools with the aim of enhancing our customers’ digital experiences.”
“Coordinating the systems will allow us to easily set up new customers or synchronise cropping for existing customers who use GLGM software,” he explains. “What does this mean practically for a farmer? When next year’s field information is being decided, it will flow seamlessly through from GLGM to MySOYL, allowing fertiliser recommendations, seed rate plans and nitrogen plans to be created without double entry of the same data. When new land is set up, field records such as names, boundaries and cropping will already be populated.
“Connectivity of our systems to allow a smoother digital experience for our customers is an on-going priority of ours. While this is a small step, it continues our journey to that end.”
Digital precision with new app from John Deere.
With a new site-specific app developed by the German start-up company Solorrow, growers can now create variable rate application maps for fertilising and other field operations and share them with the John Deere Operations Centre.
From there, maps can be sent wirelessly to machines in the field to enable more precise applications, so that fertilisers and crop protection chemicals can be used more effectively, and the environment protected in a sustainable way.
Software and app developments are becoming increasingly important in precision farming and Deere says Solorrow offers an affordable and very easy solution, which allows users to quickly identify fields and their boundaries in a map view on their tablet or smartphone.
Based on five years of biomass data, the selected areas can then be divided into different soil zones that act as the basis for fertiliser and spray application maps. These maps can be sent from the app to the John Deere Operations Centre and then also sent wirelessly to the appropriate vehicle. The John Deere in-cab display receives the data and then gives the ISOBUS controlled fertiliser spreader or sprayer the site-specific application rate based on its current position in the field.
And this interaction between the Solorrow app and John Deere’s Precision Ag technology solutions not only has agricultural benefits.The collaboration also demonstrates that a smooth exchange of data between different manufacturers’ software solutions is both possible and practical. In this way farmers always maintain full control over their data flow and data ownership, adds Deere.