 A new climate module on Hutchinsons precision platform, Omnia, allows growers to benefit from a number of crop modelling systems, tried and tested at the company’s Helix farm in Northants. CPM finds out more.
We’re really keen to ensure that all data collected has a practical use.
By Charlotte Cunningham
In the early 90s, boyband Crowded House famously sang the lyrics: “Everywhere you go, always take the weather with you”. But what happens if we change the word ‘go’ for ‘grow’?
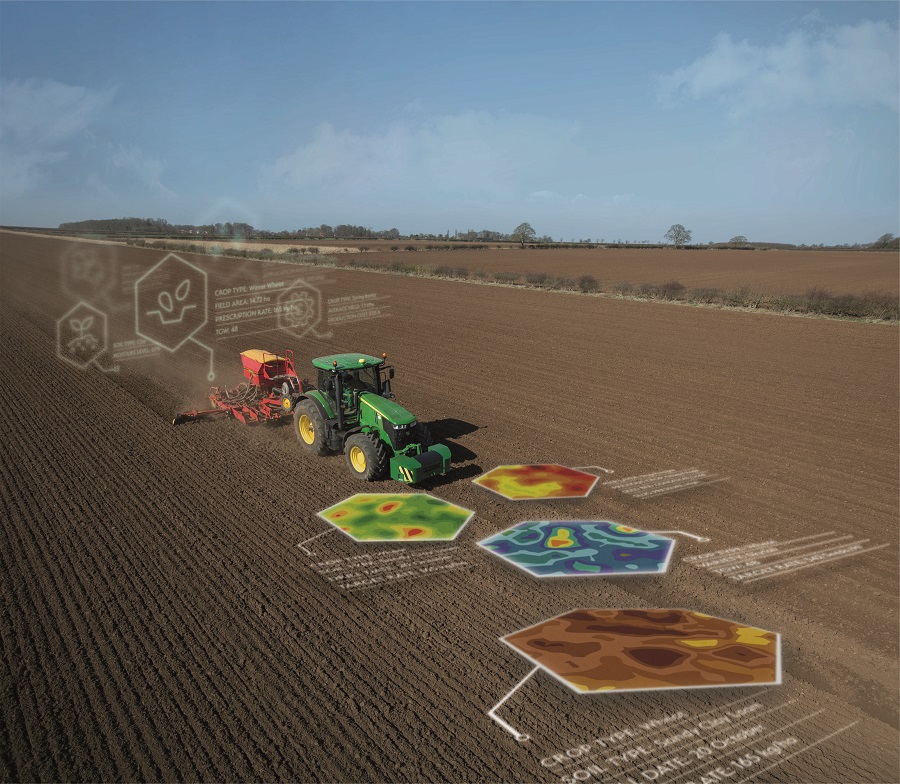
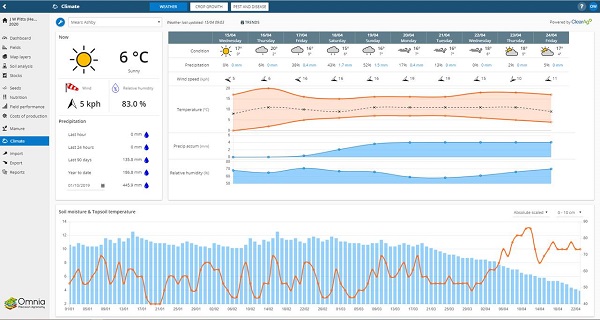
Taking the weather everywhere you grow is exactly what Omnia aims to do thanks to its latest update – a new climate module based on data collected from virtual weather stations.
Through the new feature – launched in April – the climate module is set to provide Omnia users with weather data accurate to 1km2, and access to historic and forecast weather and soil data – as well as a whole host of crop modelling facilities.
“This whole module has been developed from our Helix farm project and fits in with our aims of utilising the Omnia technology to increase our effectiveness – particularly around decision making by agronomists and growers,” explains David Howard, head of integrated crop management.
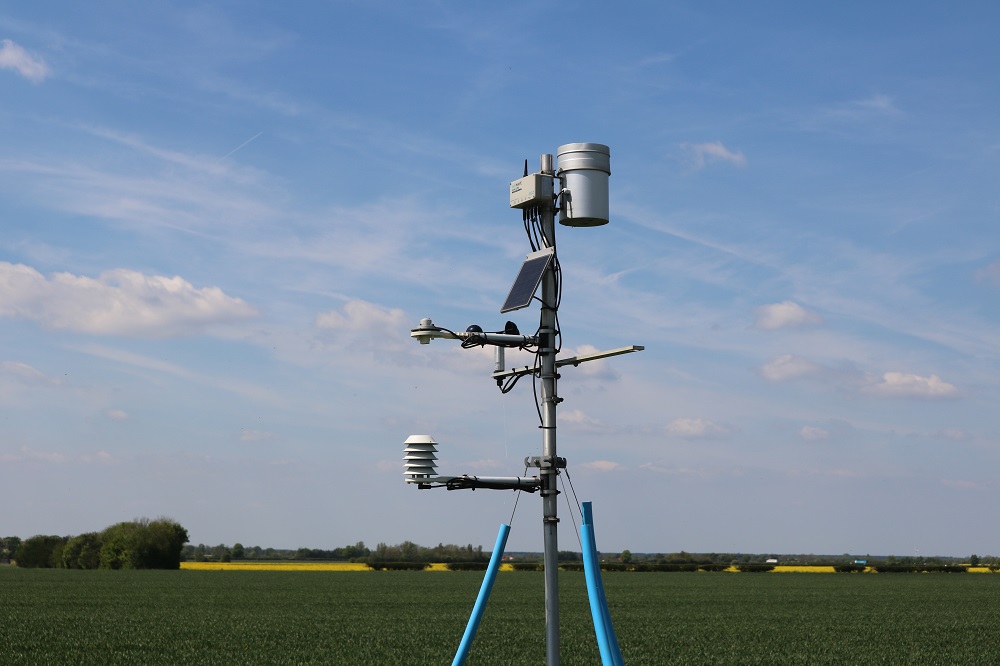
What makes it different to some other systems is the accuracy, explains Nick Strelczuk, precision technology specialist. “As part of our Helix farm programme in Northants we had a project called “Predict and Justify” and within that we were looking at installing physical weather stations.
“We wanted to put multiple stations in, but with weather stations costing anywhere from £800-£2000, we started looking into alternatives.”
As a more cost-effective and accurate alternative, Omnia’s new climate module uses virtual weather stations – based on data from the Iteris system – to provide weather data at a more precise and scalable level than physical weather stations, down to 1km 2, explains Nick. “This means, that on a holding that’s spread out, you can have multiple weather stations across the ground to give you more accurate information that can then be used to carry out further modelling.”
According to David, this gives growers an extra layer of information to help them justify important business decisions. “What we’re really keen on is ensuring that all of the data that’s out there and being collected has a practical usage. There’s no point in collecting data just for the sake of it.”
Within the project, Hutchinsons looked not only at data collection, but also modelling and now have three models within the modules available to growers: crop growth, pest and disease, and blight-prediction modelling, “With the data we’re pulling together through the Omnia platform, we are now starting to gain a real insight into what growers do, and can use the system for risk prediction, proactive decision making, remote monitoring and increased efficiency and accuracy – which have all been tried and tested at the Helix farm.”
So why is crop modelling so important?
According to David, variability is becoming an increasing part of agriculture and it’s important for growers to have access to tools to help them manage this. “This variability can include anything from crop and climate variability, to market volatility and legislative change. But this year in particular, crop and climate variability is having a massive effect on what’s in the ground now and what growers are able to put in the ground going forward.”
As a result, there’s a real drive for businesses to be risk averse, he adds. “It’s one of the key elements of farming. There’s a number of external pressures on the industry and it’s important we ensure that, as much as we can, we limit their detrimental effect.”
However, the only way to be truly risk adverse is to understand that risk and visualise it and that’s precisely what the crop modelling features within the climate module aims to do, explains David. “Crop modelling is a bit of a buzzword, but for me, it’s a tried and tested system that’s been widely used for a number of years.”
It’s Omnia’s belief that integrating more climate data into agriculture is the corner stone of integrated crop management.
“When tied to appropriate agronomic knowledge and other data within Omnia, there are numerous potential uses,” explains David.
“These include: accessing land with the lowest risk of soil damage; better irrigation timing; more accurate decisions regarding fertiliser type, likely utilisation and the risk to the environment; optimising drilling timing; optimised input use and selection; the prediction and minimisation of crop stress; a reduced risk of crop damage; predicted pest influx, optimised harvest timing and task prioritisation.”
Growers on the horticulture side of things have been using modelling for years, but their effectiveness in wider arable agriculture has tended to be limited by not having a reliable level of climate data – which is where this new module comes in, adds David.
“Lots of questions have been asked as to whether or not growers could truly trust the level of weather data that they were getting. It’s fine if you happen to be next door to your nearest Met Office weather station, but once you’re 20, 30, 40 km away from the station – is the information really valid to use on your farm?”
“With the Iteris system, the resolution is down to 1km 2, meaning growers are now able to make field-specific decisions.”
Crop growth modelling
The first element of the new system is the crop growth modelling facility, explains David. “Because crop growth is related to a number of climatic factors, particularly degree days, we can use that information to track crop growth and predict key growth stages.”
To calculate this, the software uses a combination of the 10-day forecast and the long-term average weather data to start to predict when growers are likely to see certain key growth stages.
Delving deeper into the detail, users can look at specific fields and are presented with a sliding scale to give a visual representation of crop growth and certain growth stages. “This means growers can better plan inputs and workloads, as well as being able to take a proactive approach to predicted stress periods.”
In terms of visual representation, a blue dotted line on the field information graph quickly and easily tells growers crop growth stage, and the next predicted growth stage.
Taking the innovation one step further, each predicted growth stage is matched with an estimated date of when growers are likely to meet said growth stage.
Though the estimations are a pretty accurate guide, the model does allow for manual amendments, explains David. “This means that if an agronomist arrives on farm on the predicted growth stage date to find the crop isn’t actually quite there yet, it can be reconfigured manually – there’s no point in having a model that doesn’t reflect what’s in the ground.”
When situations arise where this reconfiguring has to take place, it actually benefits the system, he notes. “As the system is used and changed by growers and agronomists, it informs the models – which are using AI in the background – meaning over time, the overall accuracy of these models improves based on the data from that specific farm.”
Pest and disease forecast modelling
Following the loss of neonicotinoids, growers have been left to balance fairly limited control options with increased BYDV pressures, but the new pest and disease forecast model in the climate change module aims to tackle this. “We began this process by creating a BYDV model,” explains David. “Obviously, the risk of BYDV has increased massively since the loss of neonics and we’ve got a relatively limited armoury to give us protection, meaning it’s imperative treatment timings are as accurate as they can be.”
According to David, one of the biggest challenges when it comes to managing these timings is keeping a track of when crops have been drilled. “Particularly in a year like this one, growers might have wheat that was drilled in November, right the way through to February, and everything in between.
“So keeping track of those timings and then applying this information to the model, helps to let farmers know when specific fields are likely to become at risk.”
With every different drilling date meaning individual fields will experience a different risk period and be exposed to risk at different times, the software allows users to see on a field-by-field basis exactly where they are on the risk spectrum.
“In terms of visual representation within the software, the risk is presented in a graph, and accrues degree days along the 170 degree-day model that’s frequently used, explains David. “The graph counts up time and as it reaches 150-day degrees, it shows up as a warning period to alert growers when they’re reaching a key timing.
“Though these models obviously can’t confirm whether or not there are aphids in the field, what it does do is send an alert to warn growers that they ought to go out and check the crops. Once that’s done, an assessment can be made about whether or not a treatment needs to be applied.”
As with the crop growth model, growers and agronomists can manually configure the model, and treatments – plus treatment dates – can be added to reset the model. “This is a really visual way of keeping an eye on risk periods,” explains David. “This data can also be collated into a report to illustrate the levels of risk across the whole season and how they were treated, which could prove to be really beneficial when it comes to making business decisions in the following years.”
Blight monitoring and prediction modelling
Another strand of the climate module is blight period forecast modelling, using the Hutton Criteria model.
“This is the most modern framework and it gives us the climate information to drive both the current and 10-day forecast weather and therefore, blight risk,” explains David.
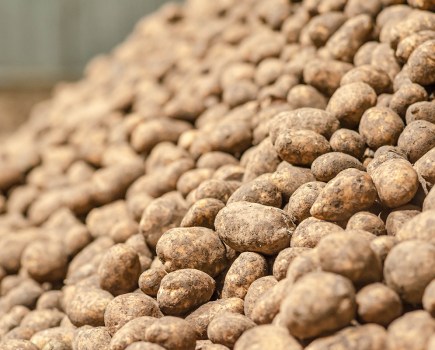
One of the key benefits of this model is task prioritisation and management. “Particularly in the case of potato growers, crops are often grown over quite a wide area, where reliance on a single physical weather station just wouldn’t be sufficient,” he adds. “So with our virtual weather stations they can be placed at each field group this gives the grower valuable information about those specific fields – allowing them to prioritise where they need to be and when.
“That’s going to be particularly important in compact seasons, where ensuring you’re in the right place at the right time becomes key.”
Similar to the BYDV model visually, the module uses a coloured traffic light system to flag up risk periods.
“The amber coding tells growers that they’ve reached part of the criteria of the Hutton, but not fully,” explains David. “We felt that it was important to show all of the risks fully as we approach them, and to allow for things like irrigation which obviously this system can’t pick up on.”
When a full Hutton period occurs – 10 degrees and more than 90% humidity over six hours – or when one is imminent in the next 10 days, the coding system will turn red and alert growers so that they can ensure they’re bang on the money with blight sprays, he adds.
The risk spectrum – including partial risk – can also be viewed from a whole-season perspective, and this can be compared with treatment programmes to ensure crops have protection right the way through the season, explains David.
“This will be really useful in situations where poor weather means growers can’t access crops when they’d like to. Using the model, we can determine how many risk periods the crop has experienced in that time, as well as how important something like curative activity from fungicides is going to be. It can drive some really useful decision making.”
Try before you buy
For those interested in finding out more about the platform, Hutchinsons has also launched a new Omnia Access level, giving growers the opportunity to ‘test drive’ the software for free, says Nick. “Anyone with access to the internet will be able to login to the new Access level, create a farm, set up boundaries and cropping, and have access to modules such as fields, map layers, climate and stocks.”
While it’s often said there’s no such thing as a free lunch, Omnia Access is in fact completely free of charge as part of a drive to help growers get a better understanding of how they can collect and use on-farm data, he adds. “If you’re not doing something with data now, you’re more than likely going to have to in the future, so by offering Omnia for free it gives growers the chance to start that journey.”