Although earthworms are widely considered to be a good indicator of soil health, new research identifies nematodes provide a better insight. CPM finds out more.
The precise balance of the extremely diverse nematode communities is important.
By Rob Jones and Lucy de la Pasture
Simplistic measures of soil health can be extremely misleading, this is the clear understanding emerging from the latest soil health research by Harper Adams University and Agrii as part of the Horizon 2020-funded Agrocycle project led by University College Dublin.
Under the joint EU/China project, designed to make the most of agri-food wastes, post-graduate researcher Ana Natalio has been investigating the best ways of monitoring changes in soil health by measuring biological and physico-chemical parameters.
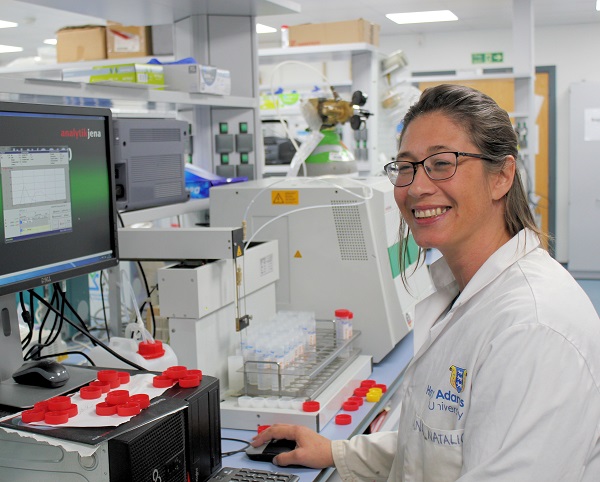
Ana Natalio has found nematodes to be the best bio-indicator of soil health but measuring populations is too expensive to be practical.
In pursuit of a practical way for farmers and agronomists to assess the biological status of their soils alongside chemical and physical qualities, she has examined a whole range of bio-indicators from microbial biomass carbon and earthworm ecotypes to springtail groups and nematode communities.
“Soil health improvement has risen rapidly up the agenda for politicians as well as farmers,” she points out. “At the same time, a wide range of biological tests are being offered and promoted. Unfortunately, they all have limitations as useful measures of soil health in agricultural systems.
“For instance, different soil organic matter (SOM) testing methodologies give very different results. SOM levels change only very slowly and a favourable balance within the organic matter is as important for soil health and vitality as its absolute level.
“While microbes tend to be the dominant group of soil organisms in terms of biomass, they respond too rapidly and transiently to changes in management practices and environmental conditions, limiting their practical use,” says Ana.
“Equally, measures of soil respiration tell you nothing about the balance between favourable organisms and damaging ones or the diversity of their communities, which is likely to be crucial for the most resilient soils.
“Earthworms can be a good indicator of soil structure and are important in nutrient cycling, but there are highly productive soils that have very few worms. The balance of earthworm ecotypes is important and detectable numbers vary widely with soil conditions.
“Springtail populations, which are also good indicators of soil structure and respond more quickly to changes in management than earthworm populations, can vary very widely too, and are difficult and expensive to measure,” she explains.
“Of all the bio-indicators we’ve assessed, nematode populations offer the greatest value in monitoring soil health. They respond distinctively to organic enrichment, environmental disturbance and in their sensitivity to pollutants. In our work we’ve seen striking differences in nematode communities in response to management changes.”
Nematode analyses to the degree that Ana has found to be essential as a useful measure of soil health require considerable expertise and are very costly – starting at around seven-times a standard soil test. Unfortunately, her research also shows that simple nematode assessments designed to overcome these limitations aren’t of much use.
“More than anything else, we’ve found the precise balance of the extremely diverse nematode communities is important. But even if you know this, you really can’t compare measurements from different soils under different rotations and conditions. Instead, you need to establish biological benchmarks for specific sites and monitor them in a consistent and carefully-structured way over time,” she continues.
Even though her research shows there’s a meaningful way of measuring soil health using biological parameters, it’s a way that isn’t currently practicable. So how can land managers reliably plan to improve soil health?
Senior agronomist, Andrew Richards of project partners, Agrii believes there’s a way round this apparent impasse. A way which involves applying a number of well-understood soil health improvement approaches in carefully-planned and recorded strategies.
“Research confirms that nematodes and other soil fauna and flora are extremely sensitive to one soil parameter we can and do measure easily and regularly – pH. Maintaining soil pH between 6.5-7.5 is obviously essential in any improvement plan and for its value in ensuring the best-balanced nutrient availability.
“We know well-structured soils are vital to soil health in arable regimes, as is the right – which generally means less – tillage, good crop rotations, less bare soil over the winter and organic matter addition. At the same time, we know that all soils and farming systems are different,” he comments.
“Until we have the reliable soil health benchmark data we need, our improvement efforts really need to be focussed on specific management plans involving things we can actually measure,” he reasons. “Plans that reflect our particular systems, are geared to what needs to be achieved and are flexible enough to be adapted to changing seasonal challenges.”
Andrew insists that improving soil health and resilience has to be a key priority for many growers. If they are to achieve this without simply adding extra cost to their farming enterprise, he sees good science and down-to-earth thinking as essential.
“At the moment, soil health testing is a perfect example of just how dangerous a little knowledge can be. Our Agrocycle project work with Harper Adams is providing a timely injection of scientific reality into soil health measurement, underlining just how biologically complex soil is and how many things about it remain to be fully understood.
“The bio-indicators currently available provide only a very partial idea of soil health. What’s more, as with biological activity in general, they fluctuate throughout the year and are very dependent on weather and environmental conditions well outside the control of any farm management,” he adds.
“This makes it imperative that soil health improvement efforts and any future agricultural support payments linked to them must be based on the application of ‘defined good practice’ and not on any simple test, however attractive this may appear on the surface.”
Variable rate PGR boosts yield in uneven crops
Although it’s widely predicted applying variable-rate doses of crop protection products will become common practice in the future, the technology isn’t quite there yet as far as fungicide products are concerned.
But for plant growth regulators it’s a different story and applying a rate according to the size of crop canopy is possible using the same measures of biomass that are used to calculate nitrogen requirements. It’s a practice that growers are beginning to adopt in oilseed rape, says Simon Griffin, technical manager for precision farming specialists, Soyl. What’s more, tramline trials are showing a positive yield benefit where variable rate PGR has been applied.
In OSR the benefits of reducing lodging and influencing the canopy from using PGRs are well established, says Dr Paul Fogg, crop production technical lead at Frontier. “ADAS studies have shown 31% of the UK crop area lodges each year at 45⁰ or more, with 85% of fields at least 10% lodging. The average cost of lodging is estimated to be £77/ha, costing the industry up to £120 million/yr.
“PGRs can be applied from early stem extension to the late green bud stage of the crop. At the earlier timing the main effect is to mitigate lodging by shortening and thickening of the stem, as well as increasing branching. Later in the application window their effect is more on the architecture of the canopy,” he explains.
“By manipulating the canopy size and structure it’s possible to improve light capture, enabling more UV light to reach the lower canopy which leads to more even flowering and ripening of the crop,” he explains.
While applying a PGR may sound like a no-brainer, there’s an important relationship between the crop’s biomass and the PGR’s potential effect on yield to consider, says Simon. “If the canopy is too small then there can be a negative effect from the PGR to crop yield. But work by ADAS has shown that crops with a GAI of more than 0.8 will benefit from treatment.”
Influence of PGR on yield at different GAIs
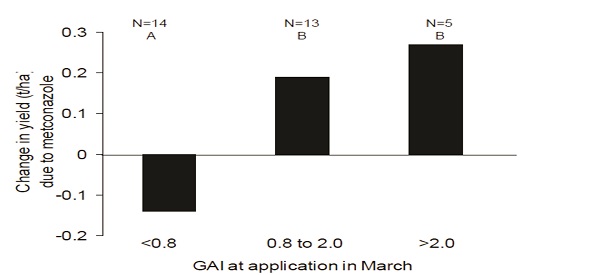
Source: ADAS
The problem for growers is when the crop canopy is variable across the field, meaning PGR application may be needed in some parts and not others, explains Simon.
Understanding the reasons for variability in OSR crops is key to producing consistent yields and Paul believes the information generated from precision farming practices can be a great help, enabling layers of data to be factored in to help grower and agronomist determine the best intervention.
“Variability in the crop can be driven by soil factors, such as changes in soil type which may influence the crop’s establishment. Parts of the crop can also be backward as a result of an earlier pest attack from slugs, cabbage stem flea beetle or pigeons,” he says.
Both Simon and Paul agree variable rate PGR technology is a useful addition to variable rate nitrogen application to help manage the crop canopy to achieve a more even, open canopy to increase light penetration while minimising disease pressure across the field.
Before the relatively recent introduction of Caryx (metconazole+ mepiquat-chloride), Toprex (difenoconazole+ paclobutrazol) and Circle (trinexapac-ethyl), fungicides were used in OSR for their PGR effects, so a balance had to be struck between disease protection and PGR activity.
“The availability of products registered for use in OSR solely as PGRs has opened up the potential for variable rate application to the crop and there’s increasing grower interest,” says Simon.
“We started with a few growers conducting tramline trials in fields that showed canopy variation. PGR was applied according to the crops GAI, so a higher rate of PGR was applied where the crop was thicker (GAI>2.0) and a reduced rate applied to parts of the crop where the canopy was ideal or sub-optimal (GAI of 0.8-2.0).”
The trials were assessed using yield mapping on the combine and compared with the standard farm practice for PGR in OSR of using a uniform rate across the field. “The average yield for the standard flat rate was 3.49t/ha, compared with an average yield of 3.65t/ha for the variable rate application. This equated to a yield increase of 4.39% worth £40/ha,” says Simon.