As the capabilities of data farming solutions increase, they could play an instrumental role in helping growers manage inputs now and in the future as the industry juggles record-high prices and pressure to farm with the environment in mind. CPM finds out more.
Understanding a field’s potential and addressing crop variation has never been more important.
By Charlotte Cunningham
Flicking through arable publications, nitrogen is everywhere you turn at the moment – how to reduce it, how to manage it and even how to get hold of it this season.
As the UK steams towards 2040, nitrogen isn’t a new topic of discussion – with pressure on the shoulders of growers to be more efficient with applications in a bid to slow down and mitigate the effects of agricultural emissions.
However, with prices going through the proverbial roof this season, it seems that reduction in usage is being somewhat expedited.
But this may not be as negative as growers think, with experts from leading bodies like NIAB finding that growers have historically overapplied the input (read more about this from Dr Syed Shah on page 64 of the February 2022 issue).
However, with unprecedented and changing circumstances around nutrient planning, it seems there’s a unique opportunity for smart tools and technology to play a role in helping growers be more efficient.
Hutchinsons’ digital farming manager for the south, Chris Hoskins, explains how it’s possible to realistically manage nitrogen via its Omnia platform.
“The starting point in this process is to be realistic about the yield potential of crops as this will help to decide where fertiliser will have the most impact and return on investment. Yield maps provide a real and historical picture of the best and worst performing parts of a field – even one year’s worth of data can help to visualise this.”
Within Omnia, it’s possible to use several layers worth of yield data to build a yield performance map, providing a clear picture of what areas of the field perform consistently, or not, explains Chris. “In this way, management decisions can be made based on sub-field information; it may be that a higher yielding area of the field has shown up to be potentially inconsistent, so it might not be worth pushing this area. Whereas, if another area delivers an average yield and is potentially consistent, it could be worth investing in this instead.”
Chris says that, ultimately, the crop needs to be making money or there’s no point in growing it, so this season, more than ever, it’s important to take into account the cost of N, the selling price of the crop, as well as yield potential.
“There’s a new feature within Omnia – the break-even ratio (BER) tool – that will now calculate this for growers,” he explains. “Based on the cost/t of nitrogen and the average wheat selling price, it gives a nitrogen break-even ratio – allowing for suggested N rates for each crop to be calculated which can then be adjusted, suiting both flat and variable rate applications.”
But how do we know how much to increase or decrease N? Growers should carry out a realistic appraisal of the yield potential to feed the crop where it will yield, says Chris.
“If using a variable rate approach, a break-even ratio will provide a reference point throughout the spring to refer back to in order to see if certain parts of the field are economically viable to grow crops.
Frontier
Another tool which growers may find useful this season is Frontier’s digital platform, SOYL, which has recently benefitted from an investment in radar imagery to upgrade its variable nitrogen service.
The new image technology is unaffected by cloud cover, providing growers with more consistent and accurate measurements of crop growth and development, explains Edward Jones, sustainability knowledge exchange manager.
Delivered in partnership with agricultural satellite analysts Geosys, following extensive trials and research, the adoption of radar enhances SOYL’s biomass imagery to provide what Edward says is some of the most comprehensive crop data in UK agriculture.
So how does it work?
The technology enhances the firm’s existing biomass imagery model so that growers using the service can receive regular, high-quality cloud-free images throughout the key winter cereal nitrogen application window, he explains.
“With optical satellite imagery, cloud cover can sometimes obscure the image that’s captured and in periods of poor weather, this can mean it’s much harder for growers to access information about crop growth and performance to help with application decisions.
“Being able to access comprehensive radar imagery on a regular basis means it’ll be much easier to monitor crop development, benchmark performance and be more reactive when the data indicates a change of approach is needed.”
The incorporation of radar imagery into SOYL’s variable rate nitrogen technology is significant, particularly in seasons like the present, adds Edward.
“We already utilise imagery from nine satellites which helps us to manage issues with cloud coverage and ensures a more consistent delivery of images,” he explains. “Six of the satellites we use are tasked, which means imagery is provided to us at a premium. It’s an important investment for us because unlike free public source satellites, we can retrieve quality data at specified time intervals across the growing season.
“This means we’re able to provide growers with regular imagery when it’s most important and with that data they can make or change nitrogen application plans whenever they need to.”
He says that SOYL’s variable rate nitrogen service will be able to help growers improve nitrogen use efficiency by targeting inputs to match their crops’ requirements – at a whole-farm scale but also by identifying variations within individual fields. “The service could be of particular benefit to growers this season given the current situation with fertiliser markets and availability of product. In instances where there’s less fertiliser on the farm than usual, variable rate nitrogen can help to ensure that product is concentrated to the areas it’s needed most.”
Edward concludes: “Taking a varied application approach means the input matches the demand and this can reduce the amount of residual nitrogen in the soil after harvest.
“There are environmental benefits associated with this as it means there will be less residual nitrogen at risk of leaching into watercourses. Optimising applications can also contribute to a smaller carbon footprint too, with less work required at harvest thanks to improved crop consistency and quality.”
Rhiza
Agrii’s digital farming service, Rhiza, also capitalises on the benefits of satellite imagery.
“Since February 2021, all Rhiza customers will have received satellite imagery as part of their chosen package. Uses of this imagery range from crop walking to variable rate applications and will undoubtedly be invaluable in understanding where best to focus nitrogen spend this spring,” believes Sam Fordham, Rhiza technical manager.
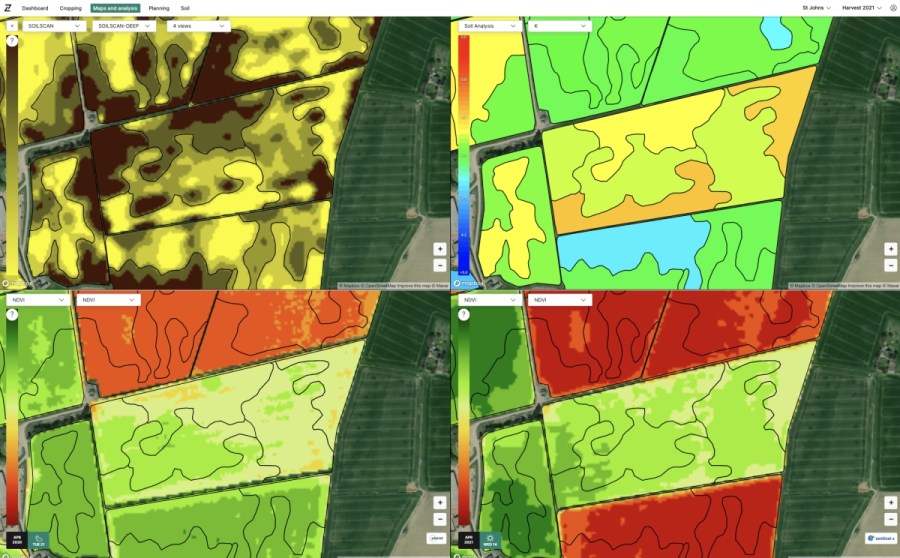
To get the most from this tool, Sam explains that firstly it’s important to understand satellite imagery and what it can demonstrate in the field. “Both NDVi and GCVi are indexes of vegetative growth (biomass). These types of satellite imagery are calculated from how much infrared and near-infrared light is reflected from a given area – typically the more light reflected, the higher the biomass of that area.
“However, it’s crucial to remember that this doesn’t necessarily guarantee a higher crop biomass as the presence of weeds will also feed into these index readings.
“NDVi imagery is suitable for assessing crops earlier in their growth phase (autumn through to mid-spring) but after this point this type of imagery can saturate and lose detail in variation. When saturation occurs, the switch is made to GCVi which is more closely related to the chlorophyll levels within the plant. This allows us to see more detail later in the season and is very useful for protein applications in milling wheats.”
Sam says it’s essential to ground-truth satellite imagery to gain an understanding of what each map is illustrating. “As previously mentioned, green maps can indicate well-established fields but in other cases, these maps could highlight areas of blackgrass.
“Many of our customers and agronomists use satellite imagery and contour mobile to aid their crop walking, log any observations and gain a better understanding of the variation within their crops. With fertiliser prices at an all-time high, understanding a field’s potential and addressing crop variation to ensure that spend is distributed appropriately has never been more important.”
As many in the industry have already discussed, variable nitrogen applications will be key in maintaining the break-even ratio of nitrogen applications this spring. Sam adds that after verifying the satellite imagery and assessing crop variation, decisions can be made as to where yield potential lies and how spend should be attributed. “With reduced total nitrogen application on some crops, ensuring the optimisation of other areas with potential will secure a reasonable gross margin.
“Nitrogen inhibiter products such as Liqui-Safe or Enhance will also reduce the volatilisation and leaching losses. Coupled with a variable approach, this will ensure that money isn’t spent unnecessarily.”
But the innovation doesn’t stop there…
While further information is under wraps at time of publication, Rhiza is planning on launching what it calls industry-leading satellite imagery in February, which the firm says will be the first of its kind in the UK. Watch this space for more information…