Farming is experiencing a paradigm shift, with increasing emphasis on measuring and improving biological systems rather than relying heavily on external artificial inputs. But how can these be accurately and consistently measured? CPM reports from the No-Till on the Plains Conference to hear how things are done State-side.
There are multiple sources of salt out there, some good and some bad.
By Emily Padfield
Described as ‘soil testing in nature’s image’, the Haney Soil Health Test is widely used and respected in the US by farmers. Named after the USDA scientist Rick Haney, it includes over a dozen different soil test values which include the usual N, P, K but also soil organic N and P, microbial biomass, water extractable C as well as C:N balance.
“The test integrates chemical and biological measurements to assess the soil nutrient status, microbial biomass and aspects of the microbial habitat to determine overall soil health,” explains Lance Gunderson, owner of Regen Ag Lab, a company that focuses on established and newly developed agronomic tests designed to aid producers managing systems under regenerative principles.
“Traditional soil testing measures soil N, P and K, soil pH and % organic matter. But in the natural world the nutrient cycle is a far more complex system which alters things exponentially and is extremely difficult to replicate in a lab.”
The Haney test uses a dual extraction procedure to closely mimic natural nutrient availability to both microbes and plants in the soil environment. Described as ‘Green Chemistry’ or ‘H3A’ it uses a soil extractant which mimics natural plant root exudates, which temporarily changes soil pH and increases nutrient availability, explains Lance.
“Organic acids –malic, oxalic and citric – are excellent food for microbes and stimulate this change, but the soil pH soon returns to normal. These changes give an idea of plant available minerals aluminium, ammonium, calcium, iron, magnesium, manganese, nitrate, potassium, sodium, sulphur and zinc. They also provide levels of organic, inorganic and total levels of phosphorus.”
Microbial activity (respiration) is measured using a 1-day CO2 burst process, which uses drying and rewetting techniques to encourage a ‘flush’ of microbial activity that results in nutrient cycling and thereby mimicking a natural field event. The amount of cycling is related to soil habitat and includes available food measured as Water Extractable Organic Carbon (WEOC) and soil fertility.
This pool of carbon is roughly 80 times smaller than the total soil organic C pool (% organic matter) but it’s the food that drives soil microbes, he says. “For example, a soil with 2% soil organic matter would have 12,000ppm C. If you analyse a water extract from the same soil that number could be between 100-300ppm C.
The organic C in the soil water extract indicates the carbon that is related to microbial activity. Put simply, SOM % is about the quantity of organic C, whereas WEOC is about the quality. Think of % SOM as the house and WEOC as the house’s refrigerator, it provides the food driving the soil microbes and energy for nutrient cycling,” explains Lance.
The next measurement to think about is how much water-soluble carbon is being consumed by microbes, he continues, the ideal being between 50-80%. “If this is above 80% for too long, there’ll be an overall loss in SOM, below 50% and something else is limiting microbes.
“Organic C and N have to be balanced to get the highest potential return from the WEON bank account,” he adds. “Above 20:1 and there’s no net N-mineralisation, meaning N is limited and remains tied up in microbial biomass.
“The ideal is between 8:1 and 15:1 to allow microbes to release inorganic or plant available N and P to feed plants.”
The Haney system also allows for more accurate nitrogen requirement figures for subsequent crops, he explains. “Conventional soil tests only allow for NO3 credits, whereas the Haney measures NH4 and Organic N release, in addition to NO3.
“Across the 1.7M hectares tested in the US currently, the additional N credit average is 22.5kg/ha. That’s saved over 38M kilograms nitrogen application. Equate that to GHG emissions and that’s enough to run 50,000 cars for a year.”
Nutrient uptake and mobility
Crop nutrition has historically been driven by soil nutrient analysis, measuring the range of nutrients available in the soil to plants. However, this fails to take into account whether plants are able to access and efficiently take up these nutrients.
That’s where plant Sap analysis comes in, according to Scott Wall, founder, CEO and President of New Age Labs, who has spent over thirty years studying analytical chemistry and microbiology associated with agriculture, food safety and environmental science.
In simple terms, Sap analysis is the chemical breakdown of plant sap, he explains. “This is the measurement of mineral ions not yet incorporated into plant tissue or organic molecules (synthates) being relocated in the plant through the plant xylem and phloem. These include macro- and micro-elements, metabolic synthates (% sugars and Brix), chemical property parameters (pH and EC) and nitrogen.”
“Plant sap analysis can give a great snapshot of how nutrients are moving through a plant in real-time and identify potential deficiencies before they occur. In more conventional plant tissue testing, the time when deficiencies are often noticed is when there’s a visible sign, by which time it’s too late,” he adds.
To interpret Sap analysis you need to understand what functions xylem and phloem perform. “The Xylem transports water and mineral ions, whereas the phloem transports water and minerals in the form of organic molecules such as sugars, proteins, exudates and so on.”
Broadly, there are 25 Sap analysis parameters, categorised into three main headings: anions/cations; trace elements; and nitrogen/metabolic.
Metabolic indicators are, in essence, a measurement of photosynthetic performance and measures are total sugars; the individual sugars available, such as glucose, sucrose and fructose; and Brix, a measurement of the dissolved solids.
“Keep in mind the sample you take for Sap analysis is for the liquid, unlike the sample taken for tissue testing, which gets dried down to create an ash. This means taking samples of new, fully developed leaves and old yet still viable petiole and leaf matter.
“A simple rule of thumb for wheat would be leaves at the bottom of the plant and fully developed leaves at the top. If you have a concern about a deficiency, then put the leaves showing this in a separate bag,” advises Lance.
“Using zip lock bags, place new and old leaves into separate bags and label clearly. Let air out of bags after sampling and make sure there is at least 80g of material in each. Remember to take a cooler to store samples in when in the field, but make sure they don’t come into contact with the ice pack.
“Store them in a refrigerator until shipping and then ship them, if possible, on one- or two-day delivery in box with an insulated liner and cooling aid.”
There are many abiotic factors that can influence Sap analysis such as wind, rain, irrigation, sunrise/light and temperature. “Try to take samples before 9am and when the crop is dry. If leaves are wet use a tissue to dry them before putting them in a bag,” he adds.
Having sent your samples off and received a complex report back, how do you interpret all this new information?
For New Age Laboratories, each set of results is separated into each of the relevant headings with sugars, Brix, pH and EC in one, trace elements in another, anions such as chloride, sulphur and phosphorus in another and cations such as calcium, potassium, magnesium and sodium in another.
The ‘optimal level’ is listed alongside the actual, while there is also a gauge to show ‘Low’, ‘Optimal’ or ‘High’ to indicate where things should be. Micronutrients are listed, with the actual alongside what’s defined as high and what’s defined as low for the crop/plant in question.
Then there’s ‘Nitrogen Conversion Efficiency’, he adds, which comes with the actual results and guidelines as to where it should be in ppm.
“Different nutrient deficiencies tend to show in different areas of the plant. Mobile nutrients N, P, K and Mg show on the bottom, semi-mobile nutrients such as Zn show in the middle and non-mobile nutrients like Ca and Mn are at the top.”
This is how you can tell if there’s a cation or anion imbalance, explains Lance. “For example, in some crops there could be a high level of Mg in older leaves, but it could be low in younger leaves, with similar readings for Na.
“The complex interactions between nutrients are all at play here – depending on whether they’re immobile or mobile, or whether a cation or anion is an antagonist to another.”
Like nutrient interactions, any imbalance can then lead to reduced transfer of other anions or cations, he says. “Sap measures current nutrient uptake, deficiencies and imbalances and allows for growers to better understand and predict nutrient interactions and movement. Management decisions can then be made to target these imbalances.”
Soil conductivity
Plants need three things to grown – energy, nutrients and life, accord to Dr Thomas Dykstra. “While we know a lot about nutrients and are learning a lot more about life in the form of microbial activity, energy is something we don’t typically think of as something we have much control over.
Thomas has studied and extensively taught bioelectromagnetics for 25 years. He’s the laboratory director of Dykstra Laboratories in Gainesville, Florida and is the scientific advisor for Advancing Eco Agriculture, an organisation founded by biological and regenerative farming authority John Kempf.
In 2016, he deciphered the insect olfactory code, a work that tells us which insects are attracted to which plants and why. Thomas has done extensive work on how plant health can be linked to specific insect damage, and how measuring Brix can provide early detection of plant deficiencies.
“The energy system isn’t an area that’s usually discussed,” he explains. “Electrical conductivity (EC) is the ability of a soil to conduct electrical current. It does that through an electrolytic process which takes place principally between water-filled pores. Cations and anions from salts and nutrients dissolved in the soil carry electrical charges and therefore conduct an electrical current.
“Electricity flows as a result of potential difference. You cannot have electricity flow between two positive charges, neither can you have flow between two negative charges.
“If you look at electrical conductivity in the agricultural world, for the most part you’re measuring the amount of salt,” he adds. “Although soil EC does not directly affect plant growth, it can be used as an indicator of salinity which can impede growth, microbial activity, soil structure and drainage.
“There are multiple sources of salt out there, some good and some bad. Problem sources can be due to the over-application of fertilisers, specifically high salt NPK fertilisers. When they’re applied at the right time at the correct rate harm can be minimised, but as applications mount up year-on-year, decade-after-decade, salt levels will increase.
“Almost all pesticides, herbicides and fungicides are salt-based to make them stable. Once applied, these salts separate and can often contribute to an excess salt problem.”
One of the biggest causes of high salt can be the over application of fresh manure, he adds. “Don’t think for one second I’m saying manure is bad – it’s not. But it should be composted to reduce the over-abundance of salt. When composted the salt concentrate decreases.”
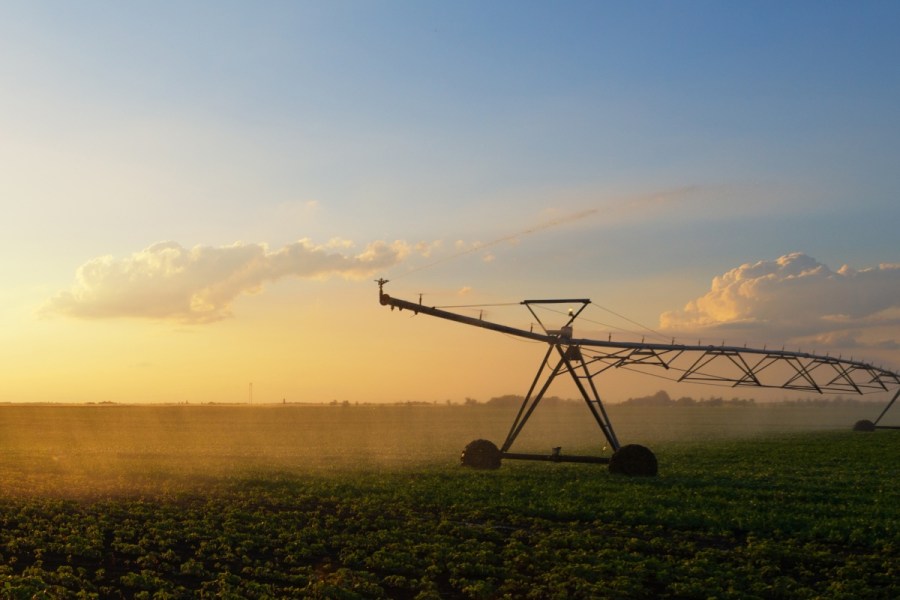
For those who rely on irrigation, application of high salt fertilisers or fresh manure can lead to the excess salt from these applications making its way through the soil and into irrigation water. “Once this has occurred, extracted water can become high in salinity. And if you then apply this through a pivot, you are effectively spreading more salt.”
Another area of concern is for regions with high groundwater tables. “If we’re applying a lot of salt-based materials, which we tend to in agriculture, the groundwater is going to contain a lot of it. If this high-salinity groundwater then hits the root zone of crops, it’ll impede the roots ability to absorb water.
However, Thomas also says that everything requires salt to function so it’s a fine balance too much and too little.
“Think of the plant having an elevator travelling up and down, transporting everything they need to grow. Electrical conductivity is moving everything: nitrogen, phosphorus, potassium: everything. If it can’t be moved it will attach onto something that can move. And if you don’t have optimum electrical flow, growth can be impeded,” he explains.
“If crops are growing in a soil with excessively high EC, they are going to be ‘hot’. Plants like to be cool, not so cool they have no conductivity as nothing moves up or down. But if you have too much salt then water uptake is compromised, and the system can be unbalanced. Roots rely on low levels of conductivity to be able to take up water, and microorganisms are extremely sensitive to salt levels.
“Tip burn can an indicator of excessive conductivity and is common when you have a high EC soil.”