Matching nitrogen rates to defined soil variability is an obvious route to optimise nitrogen use efficiency (NUE) but when that variability exists throughout the field, it’s a more demanding exercise. CPM investigates.
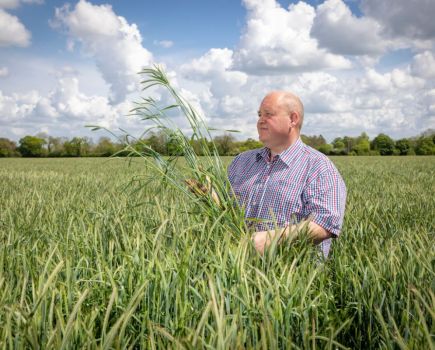
“I want to be targeting all inputs as accurately as I can and refine my nutrition strategy to improve margins and reduce our footprint.”
By Lucy de la Pasture
The rise in nitrogen prices has put fertiliser use more firmly in the spotlight, but nitrogen use efficiency (NUE) isn’t just about better input targeting, there is the greenhouse gas emissions issue too.
Shropshire farmer Andrew Williamson has been adjusting N rates on the back of N-Min tests, with applications typically ranging between 200-240kgN/ha. But he wondered whether rates could be tweaked a little lower, so he set about putting a trial together with the help of Dr Christina Baxter of ADAS and Bayer’s Max Dafforn.
Using a field of first wheat Graham, Andrew compared his ‘typical’ rate of 220kgN/ha with a rate of 160kgN/ha. He found that an interesting exercise itself but so was the nature of the trial, which involved a novel chequerboard approach.
“Because of the variability throughout the field, straight tramlines might give a skewed result. So together we arrived at the decision to divide the field into strips, with each strip getting a broadly equal share of the higher and lower application.”
Andrew typically applies N in three splits, each with a generous dose of sulphur as he feels this improves mobilisation. “Both treatments started with a solid application of 30kgN/ha with 40kg/ha SO3, followed by two further liquid applications of 96kgN/ha and 28kg/ha SO3 on the farm standard plots, which was compared with two applications of 64kgN/ha and 18kg/ha SO3 on the lower rate plots.”
Andrew points out this was just one trial but says it does pose a question over how far N rates can be trimmed before a yield penalty is observed. Analysis using FieldView showed a significant yield difference between the two treatments with the higher rates of N delivering the higher yields, though other farms haven’t seen this same trend.
The digital system also made it very easy to compare other parts of the field, particularly the poorest areas, he notes. This showed that in these areas the higher N rate didn’t increase the yield due to the inherently lower field potential.
Averaging out the high and low input results show a 12.5% uplift in yield for the higher N areas and, in this case, a £336/ha margin benefit. While any improvement in margin is welcome but, like many, Andrew is conscious of the farm’s carbon footprint and, all things considered, fertiliser has a pretty hefty step.
But there is a question mark here too, he notes, pointing out that the unknown is which approach is better – does a healthier crop sequester more carbon, offsetting the higher use of N? Andrew believes it will absorb more sunlight and have a bigger root mass to transfer more carbon back to the soil, although in this trial the kg of N per tonne of wheat produced was higher in the high N rate plots.
Last season’s trial was the first in a three-year initiative and Andrew is still to plan out the programme for the 2022/23 season. He could look at a similar trial design but he’s also considering other options, such as a straightforward 50/50 field split. But the goal remains the same, to optimise NUE.
“I want to be targeting all inputs as accurately as I can, and if I can refine my nutrition strategy to improve margins and reduce our footprint then so much the better. This first year suggests that for fields with inherent soil variability, maintaining fertiliser rates is the better option. But it is only one trial in one season.”

Richard sees FieldView data as a valuable insight for refining future agronomic practices and he will build up his ‘data library’ with further trials this season.
Richard Cross of Oxton Estate, Southwell in Nottinghamshire, is looking to develop precision farming practices across the enterprise. He also wanted to test his theory that a slight reduction in total nitrogen is possible by varying rates to match crop biomass, based on the crop biomass data captured using FieldView satellite imagery.
“Feed wheats typically receive 220kgN/ha and milling wheats an additional 20kgN/ha as a top up. For the trial, the standard dose was reduced to 200kgN/ha, with a further variation of plus or minus 20 based on whether the biomass was high or low.”
Like Andrew, he stresses it’s only one season’s results and more data is needed before any conclusions can be drawn, but through a combination of improved yield and reduced inputs the trial field delivered a £105.86/ha improvement. Had he achieved a similar result across his wheat area that equates to an extra £35,887.
A similar approach was employed with two oilseed rape fields. Here the results were more variable, with one field delivering an improvement and the other a slight reverse. But still a modest margin gain over the two was recorded.
Richard sees the data as a valuable insight for refining future agronomic practices and he will build up his ‘data library’ with further trials this season. He has added variable rate seed to the 2022/23 farm trials agenda, with three rate bands based on historic field performance.

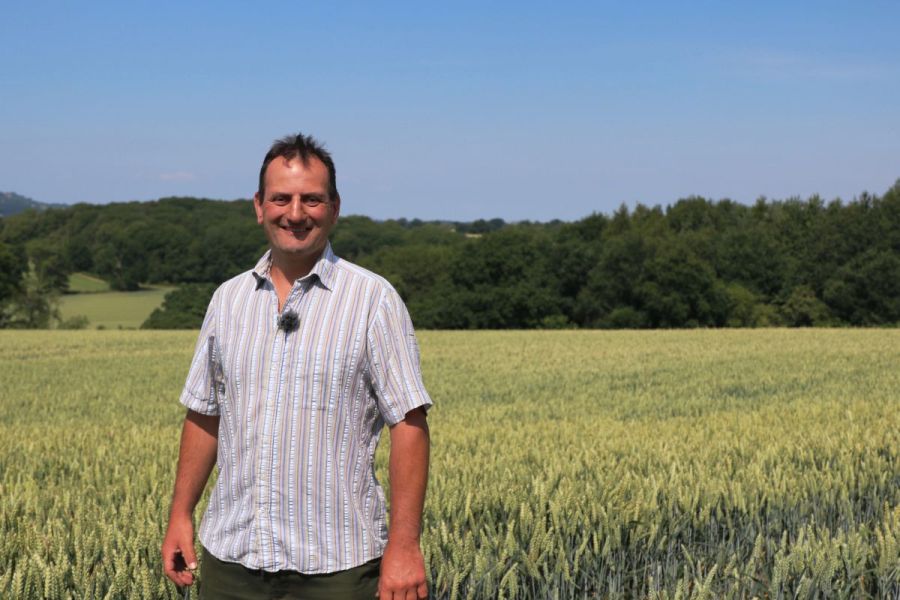
Simon Gent saw a mixed set of results with his OSR trials, with no real gain from varying fertiliser rates to reflect crop biomass last season.
Simon Gent of Stocksbridge in Hampshire also saw a mixed set of results with his OSR trials. This revealed no real gain last season from varying fertiliser rates to reflect crop biomass. Although the variable rate areas brought input savings, it resulted in a 0.1t/ha yield loss, with rapeseed at £508/t he was worse off to the tune of £20/ha.
But caution is needed when it comes to interpreting these results, says Simon. “For the purpose of the trial, it was decided to cut back N on the higher areas of biomass and apply more to the thinner areas for all applications. Interestingly, at Stocksbridge where higher rates were used on the low biomass areas, there was a return of £91.51/ha compared with the farm standard N rate.”
Some might see this as a wasted exercise, Simon doesn’t. It’s another piece of data in the library that might be useful in the future. “Rarely are two seasons alike. I’m building up data over several seasons which I can use to refine future decision making. It’s not just about improving NUE and MOIC but also our farm footprint,” he notes.
This article was taken from the latest issue of CPM. For more articles like this, subscribe here.