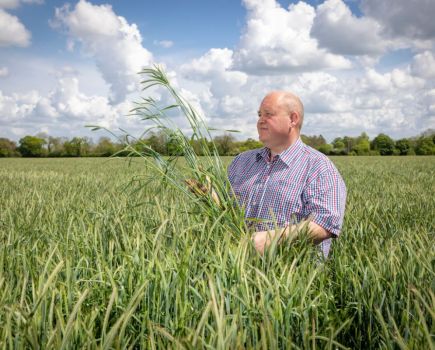
If you don’t know why you’re doing something, then you really don’t know the answer. That’s a rule Pat Thornton has in his business and CPM visits his farm in Yorkshire to find out the ‘why’ behind his adoption of new digital technologies.
I’m no teenager but I’m not a luddite
By Lucy de la Pasture and Melanie Jenkins
Low Melwood Farm is low lying at just 8m above sea level. Situated in Owston Ferry, near Doncaster, the only grassland on the arable farm is permanent pasture around the remains of Axholme Cathusian Priory, a scheduled ancient monument.
Pat Thornton is farming the 150ha farm in partnership with his father and being a relatively small farm, it’s something he can only do as he has an alternative income stream. Having previously worked as an independent agronomist and current as an agricultural consultant, Pat does his own agronomy and stresses that “the business is run as a business.” With that in mind, machinery fixed costs are reducing by working with two neighbouring farms to share key machinery.
But making a small farm pay isn’t easy, especially when it comes to adopting the latest technology. But Pat has overcome some of the potential barriers by partnering with BASF, Amazone and Meteos UK to explore how a marriage of their technologies can help his decision-making processes.
One of the challenges Pat faces is the limited number of machinery working days on the heavy Worcester series soil. “In autumn we have 17-45 days and in the spring it can be even worse,” he says. “When I’m thinking about rotation this is always in the back of my mind and after mid-October it’s a no-go on this land.”
Oilseed rape has been dropped from the rotation as if the soil dries out, as it has this season, then he can’t reliably get it established. Instead, winter beans form the break between cereal crops (winter wheat and winter barley).
“We grow Tundra for seed and because it’s a deep rooting crop it enables us to reduce cultivations to min-till or direct drilling,” he explains. “Where blackgrass is a problem then it’s spring barley that forms our first line of defence.”
The farm isn’t in any environmental schemes, but grass buffers and wildlife corridors have been established. “Taking land out of production on a farm of this size feels like voluntary redundancy to me,” he says.
Pat Thornton describes xarvio as a good companion to have your pocket when making decisions on the farm.
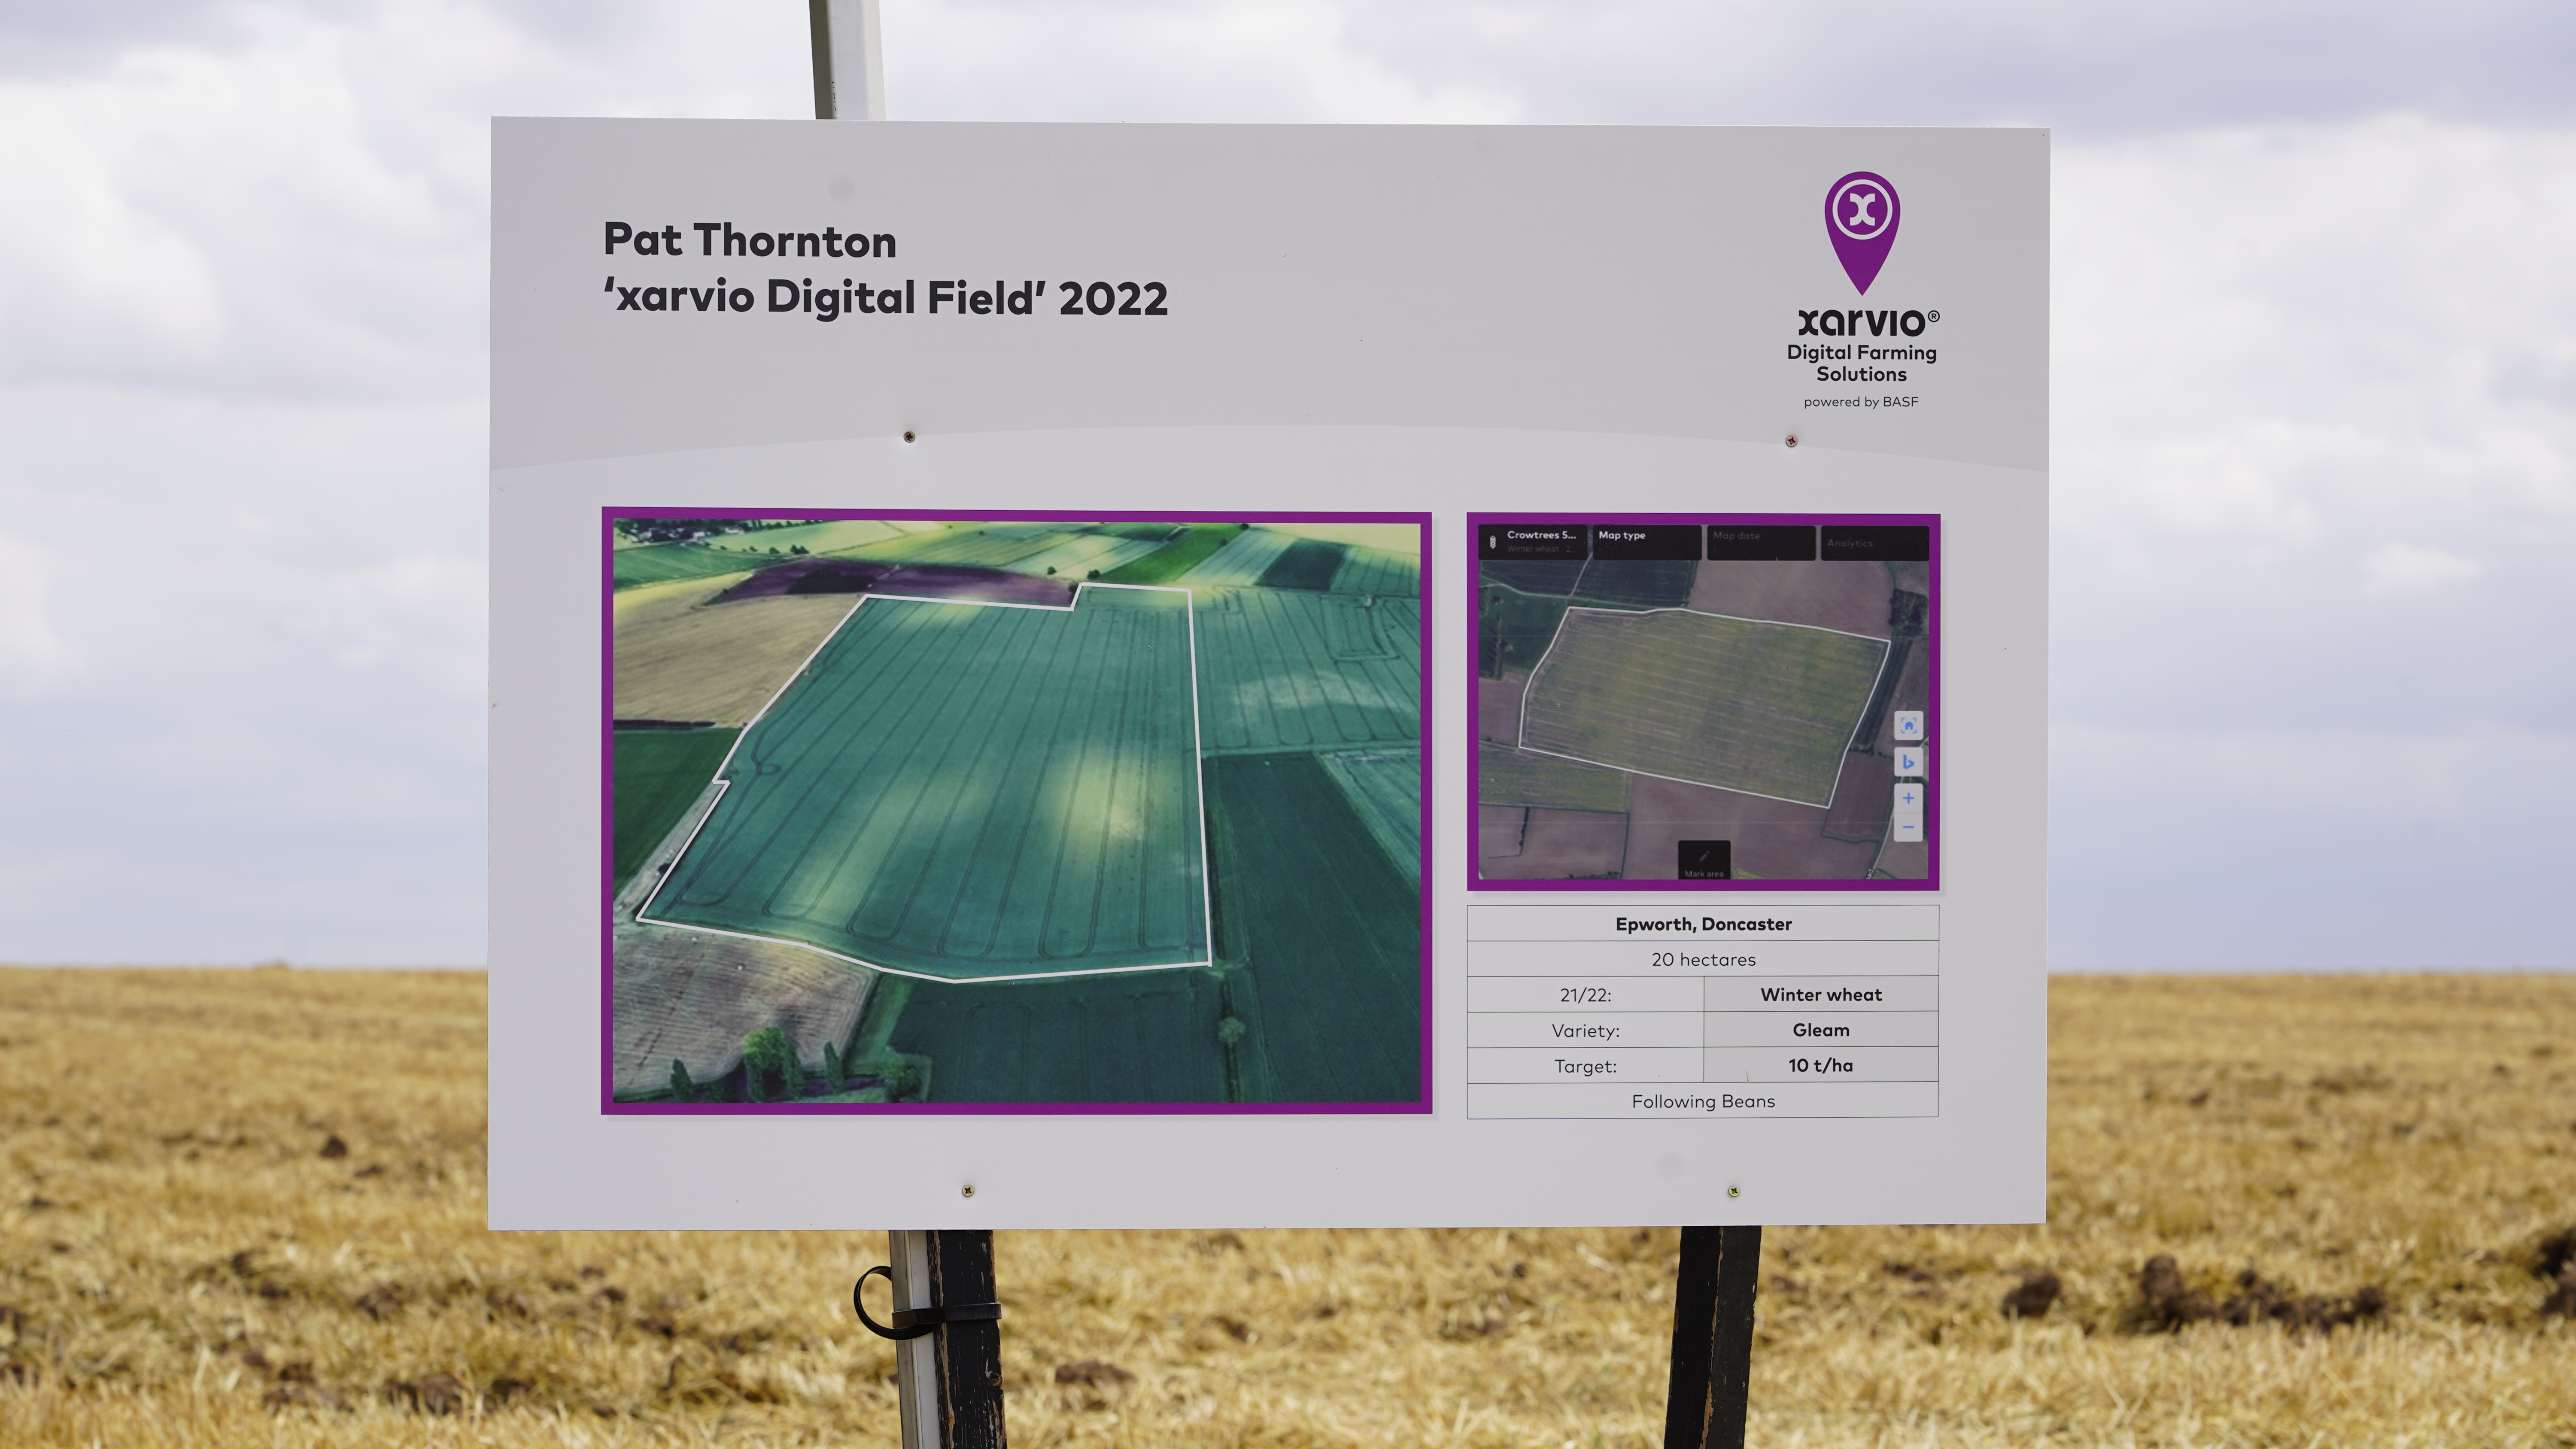
One of his aims is to even up crop performance across the farm and with that in mind, he’s been using xarvio Field Manager and describes it as “a good companion to have in your pocket.” But he hasn’t reached that conclusion without thoroughly putting it through its paces and following his rule of always asking ‘why?’
“Crowtrees field is 20ha and used to be three different fields,” explains Pat, making it a perfect trial field to variably target and optimise inputs.
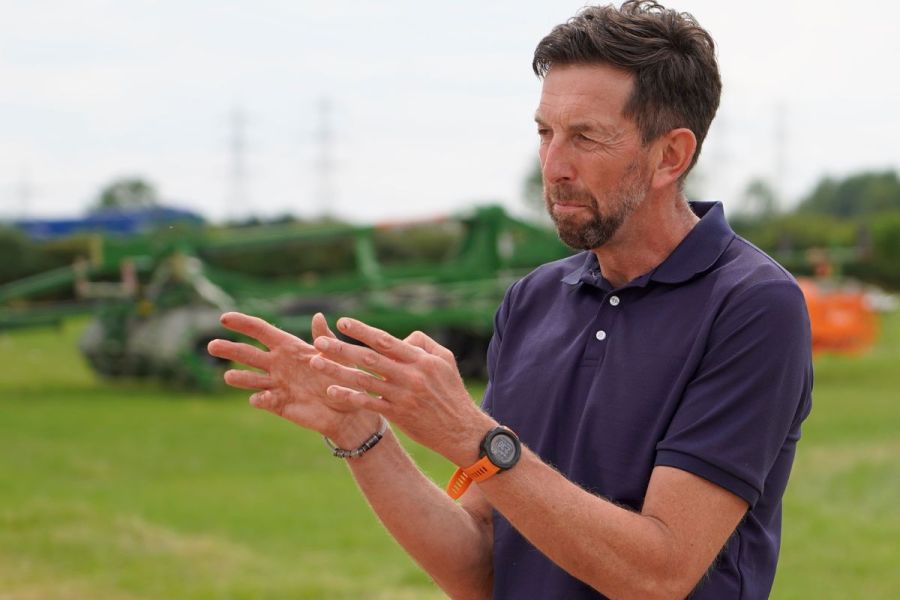
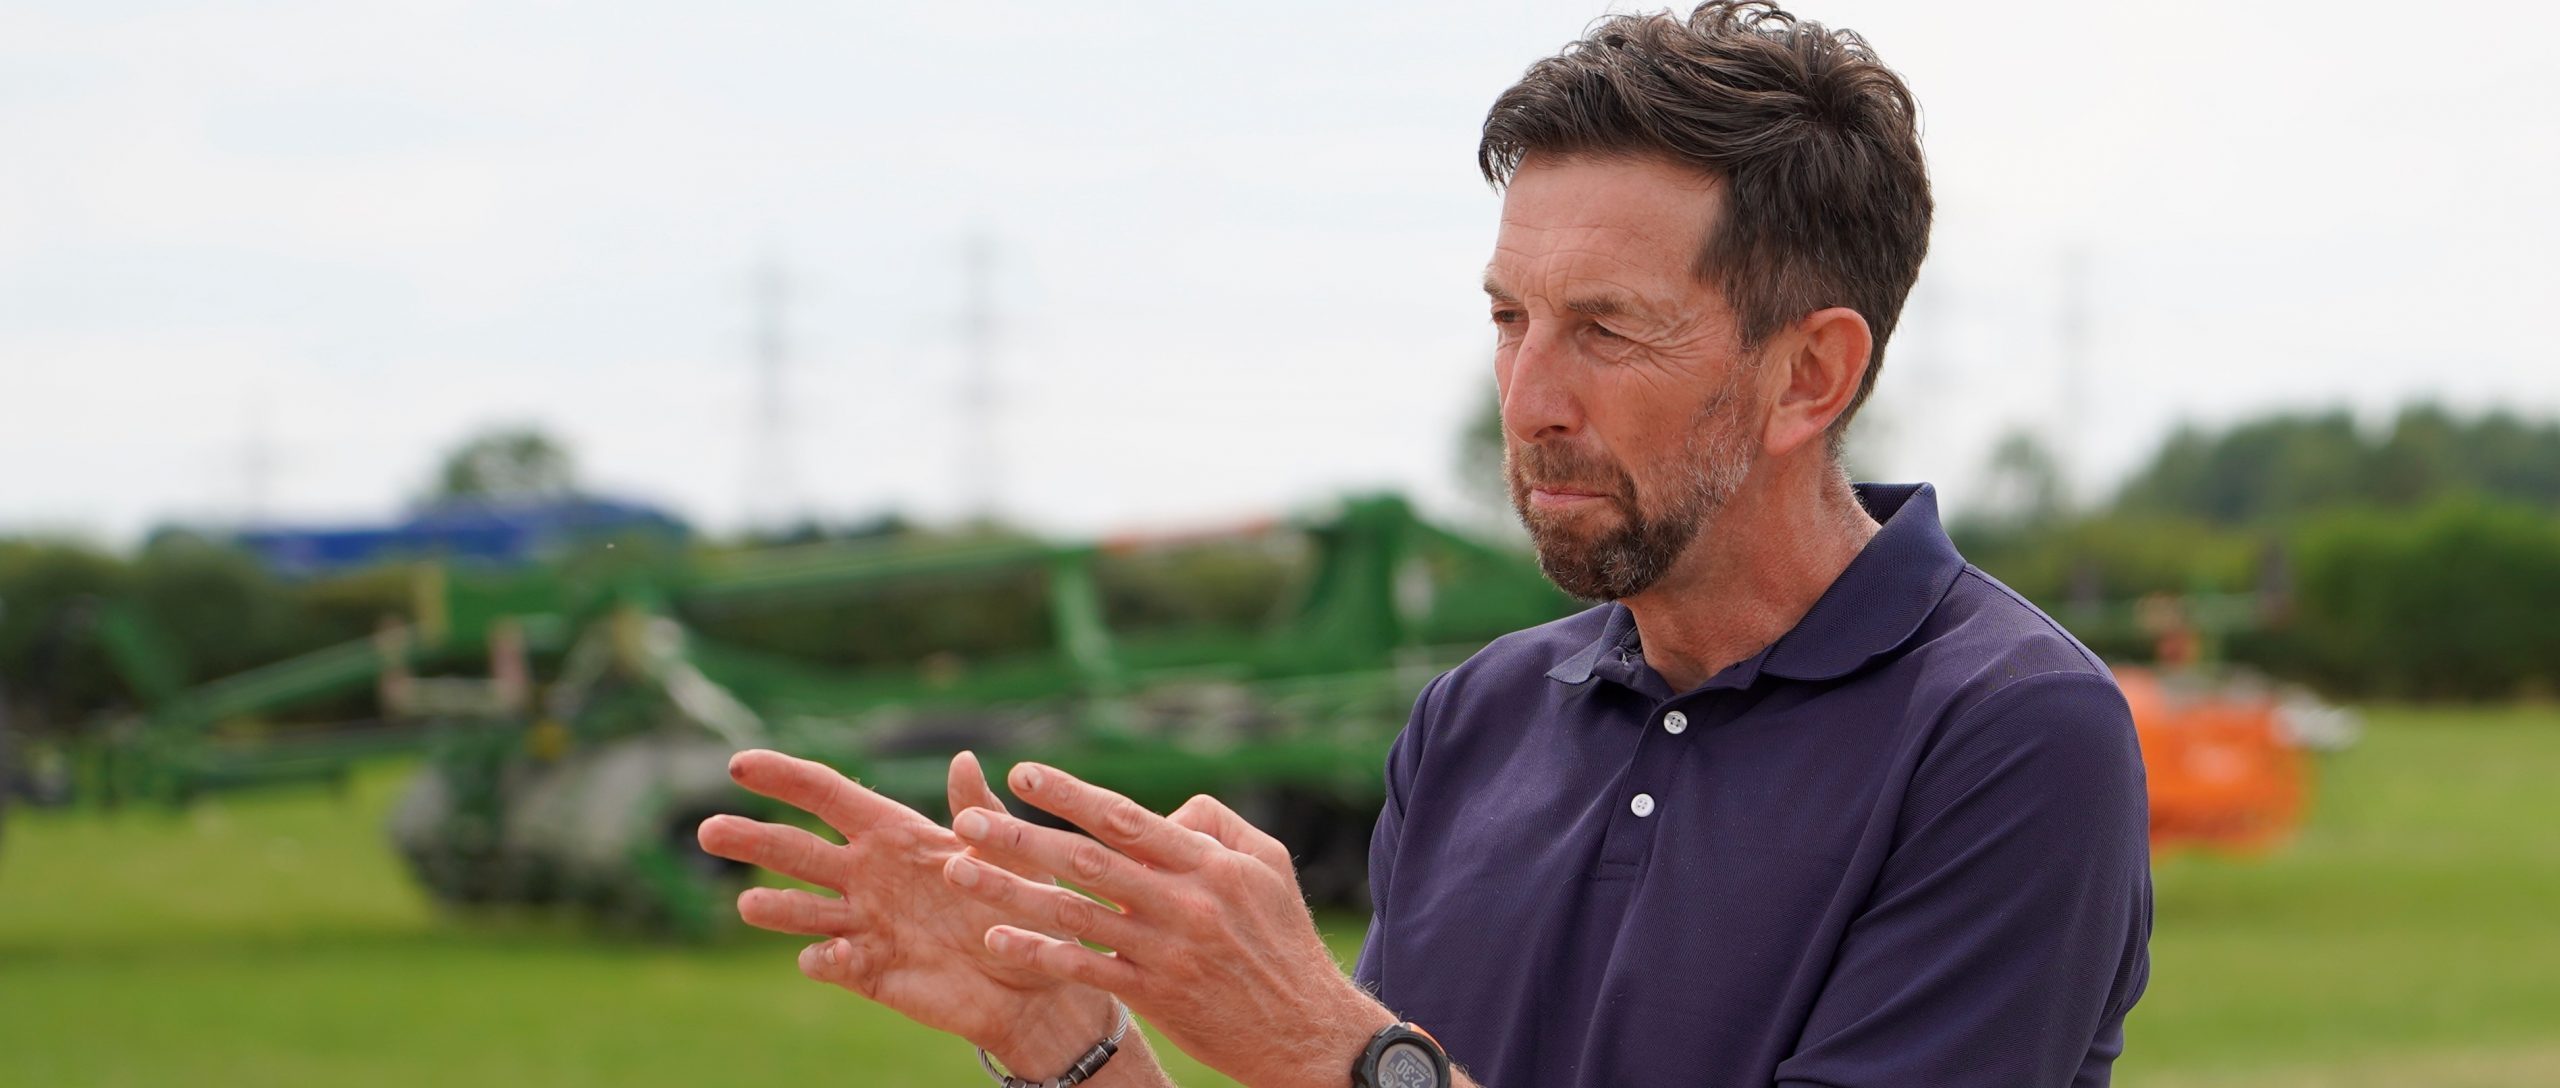
BASF’s xarvio lead Luke Pollard explains that 15 years of historic satellite imagery was first uploaded into Field Manager to create a Powerzone map – this shows the most productive areas of the field and highlights where there are variations.
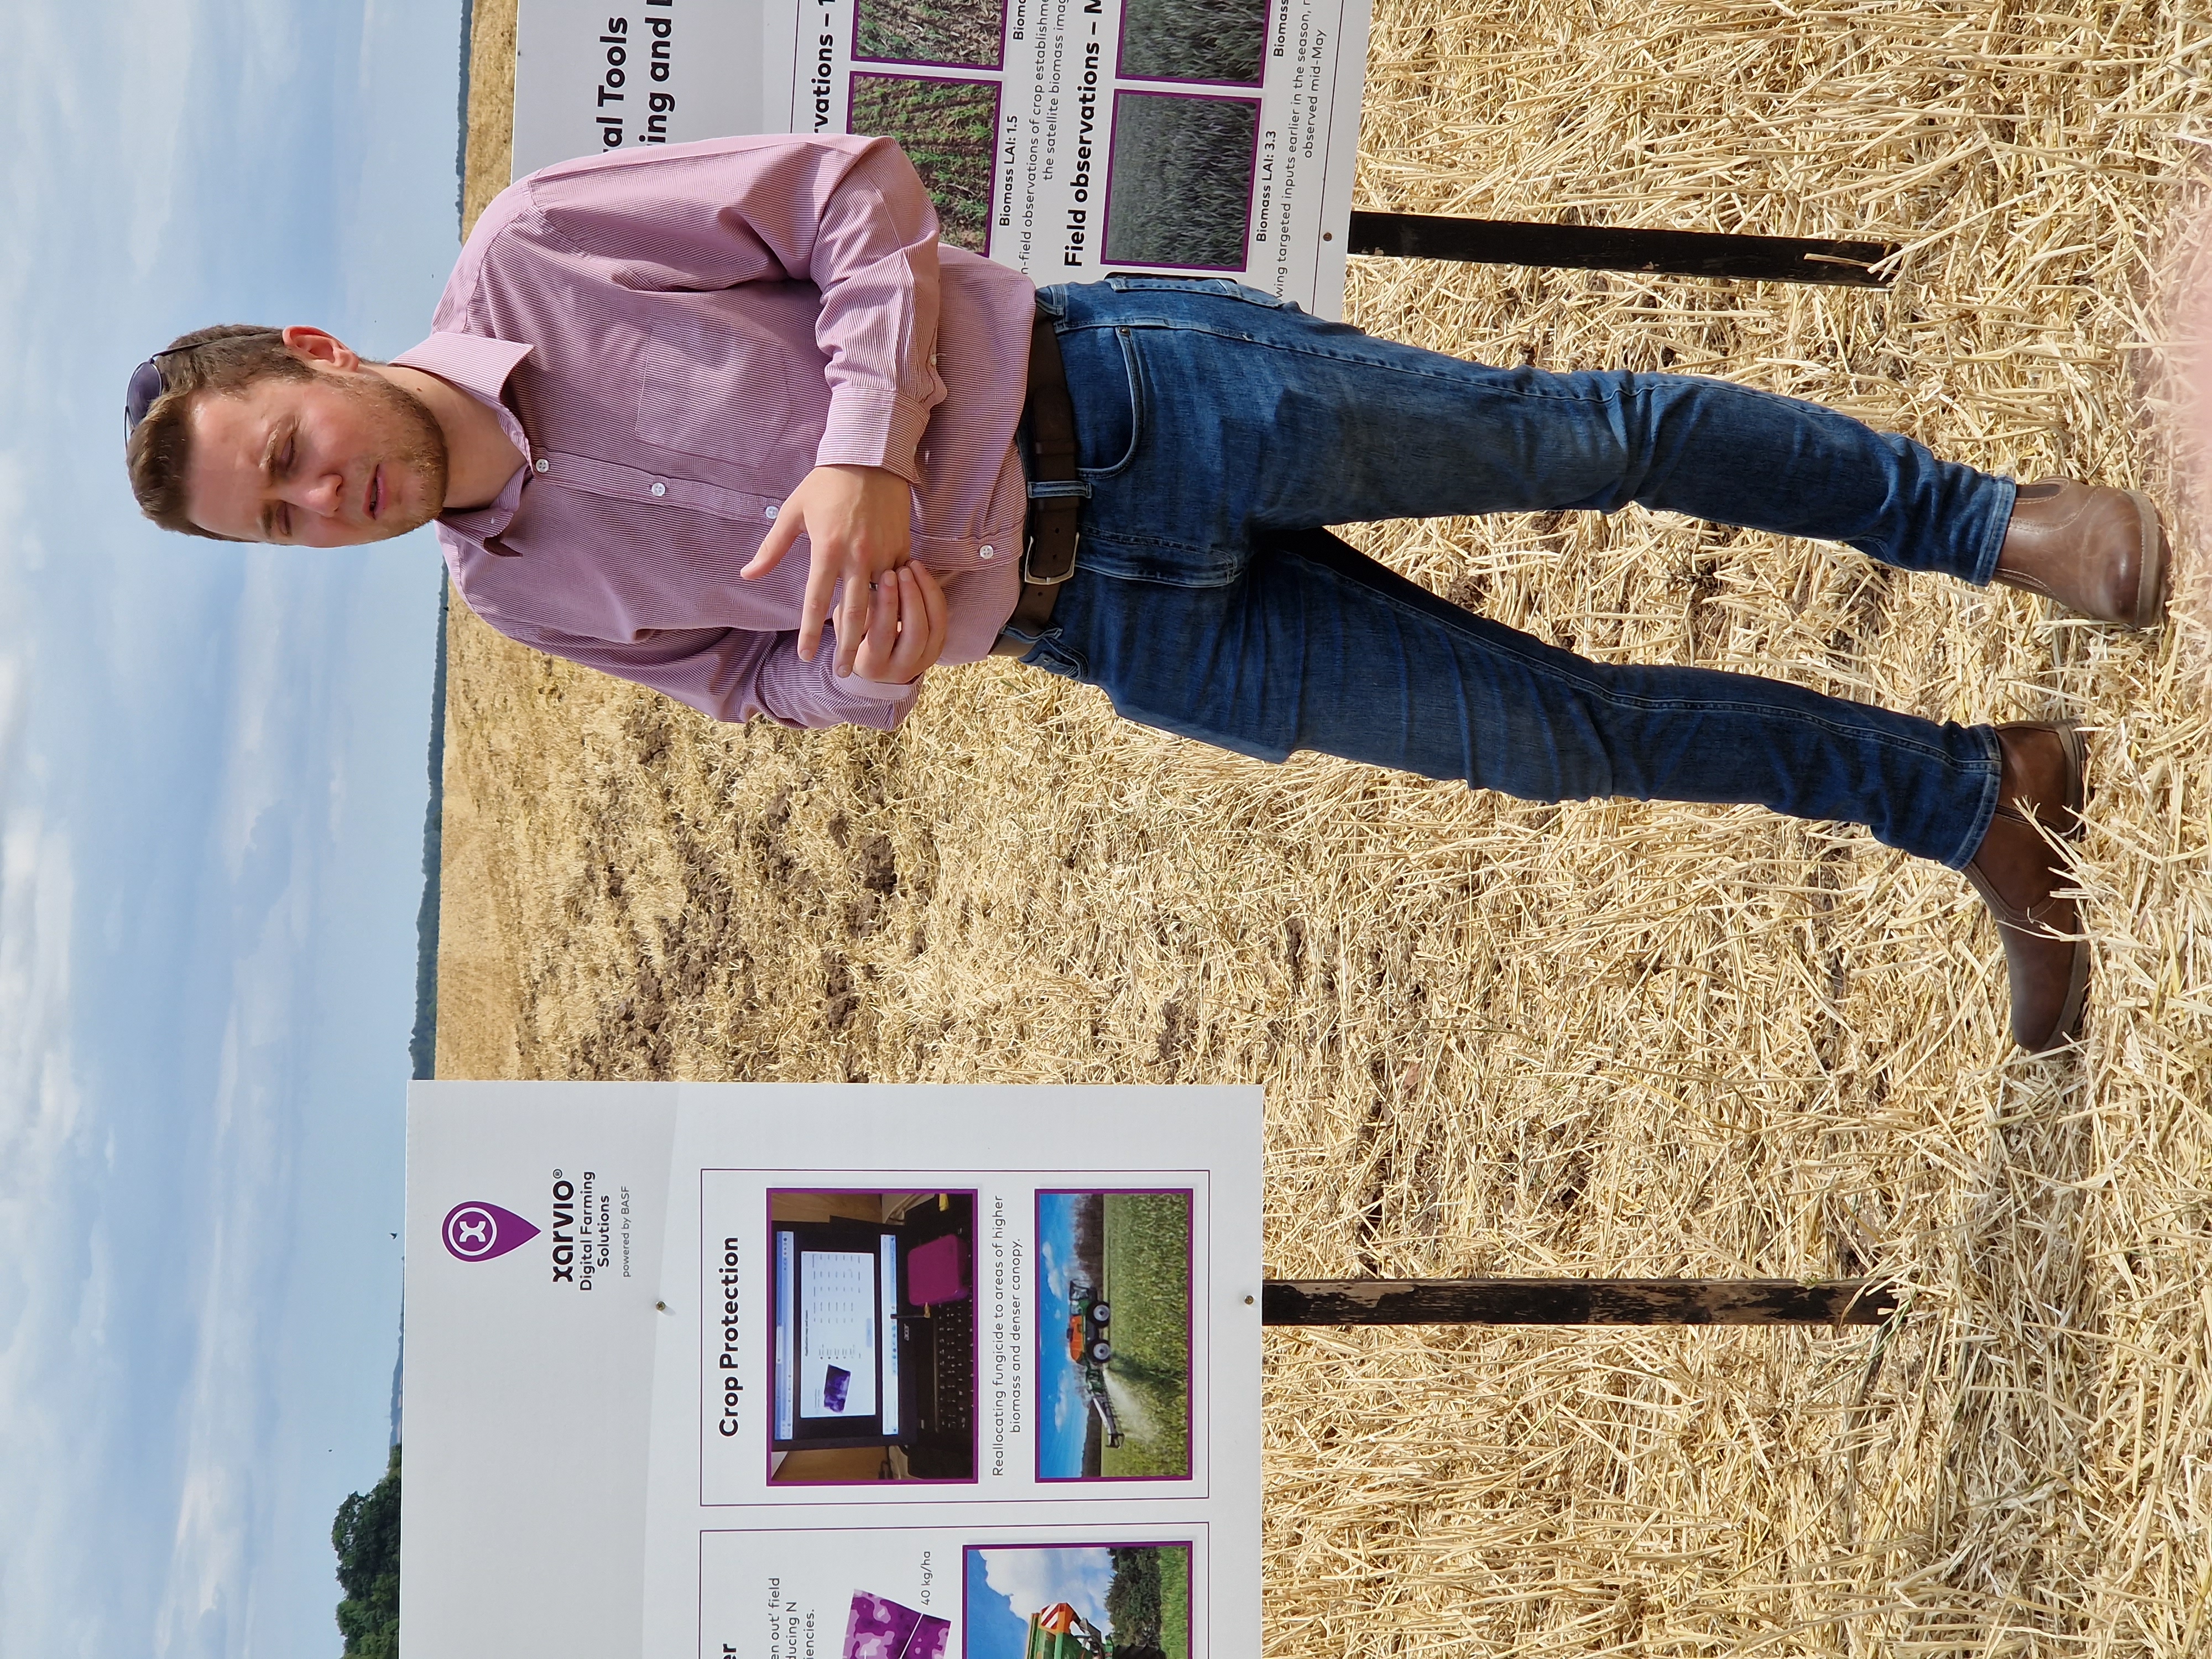
Luke Pollard explains how the data held in xarvio can be used to help decision-making and facilitate more precise application of inputs.
“Using the results, we increased the seed rate on the least productive areas to ~260 kg/ha, leaving the standard seed rate of 200kg/ha on the better yielding areas with the aim of evening up the crop,” explains Luke.
By February, variability was still evident in the field – not just using biomass scores, which were recorded ranging from 0.7-1.5, but you could see it walking the fields, says Pat. “The previous crop was winter beans and there was a lot of ben straw in places which probably accounts for areas with poorer winter wheat establishment.”
Satellite images were used to tailor nitrogen in the spring, adds Luke. “Using Field Manager and the latest satellite imagery, we were able to create an application map where the thinner areas received 60kgN/ha and a lower rate of 40kgN/ha was applied to the rest of the field.”
It’s a process which Pat says isn’t set in stone. “I still have control of the zones so can tweak how I manage them,” he adds.
By the time fungicide timings were reached in April/May, the satellite images were showing some field variation in biomass but less than earlier in the season. Pat used this to increase fungicide rate where the biomass was highest in the crop using the nifty technology provided by the Amazone self-propelled machine which connects wirelessly with Field Manager for its instructions.
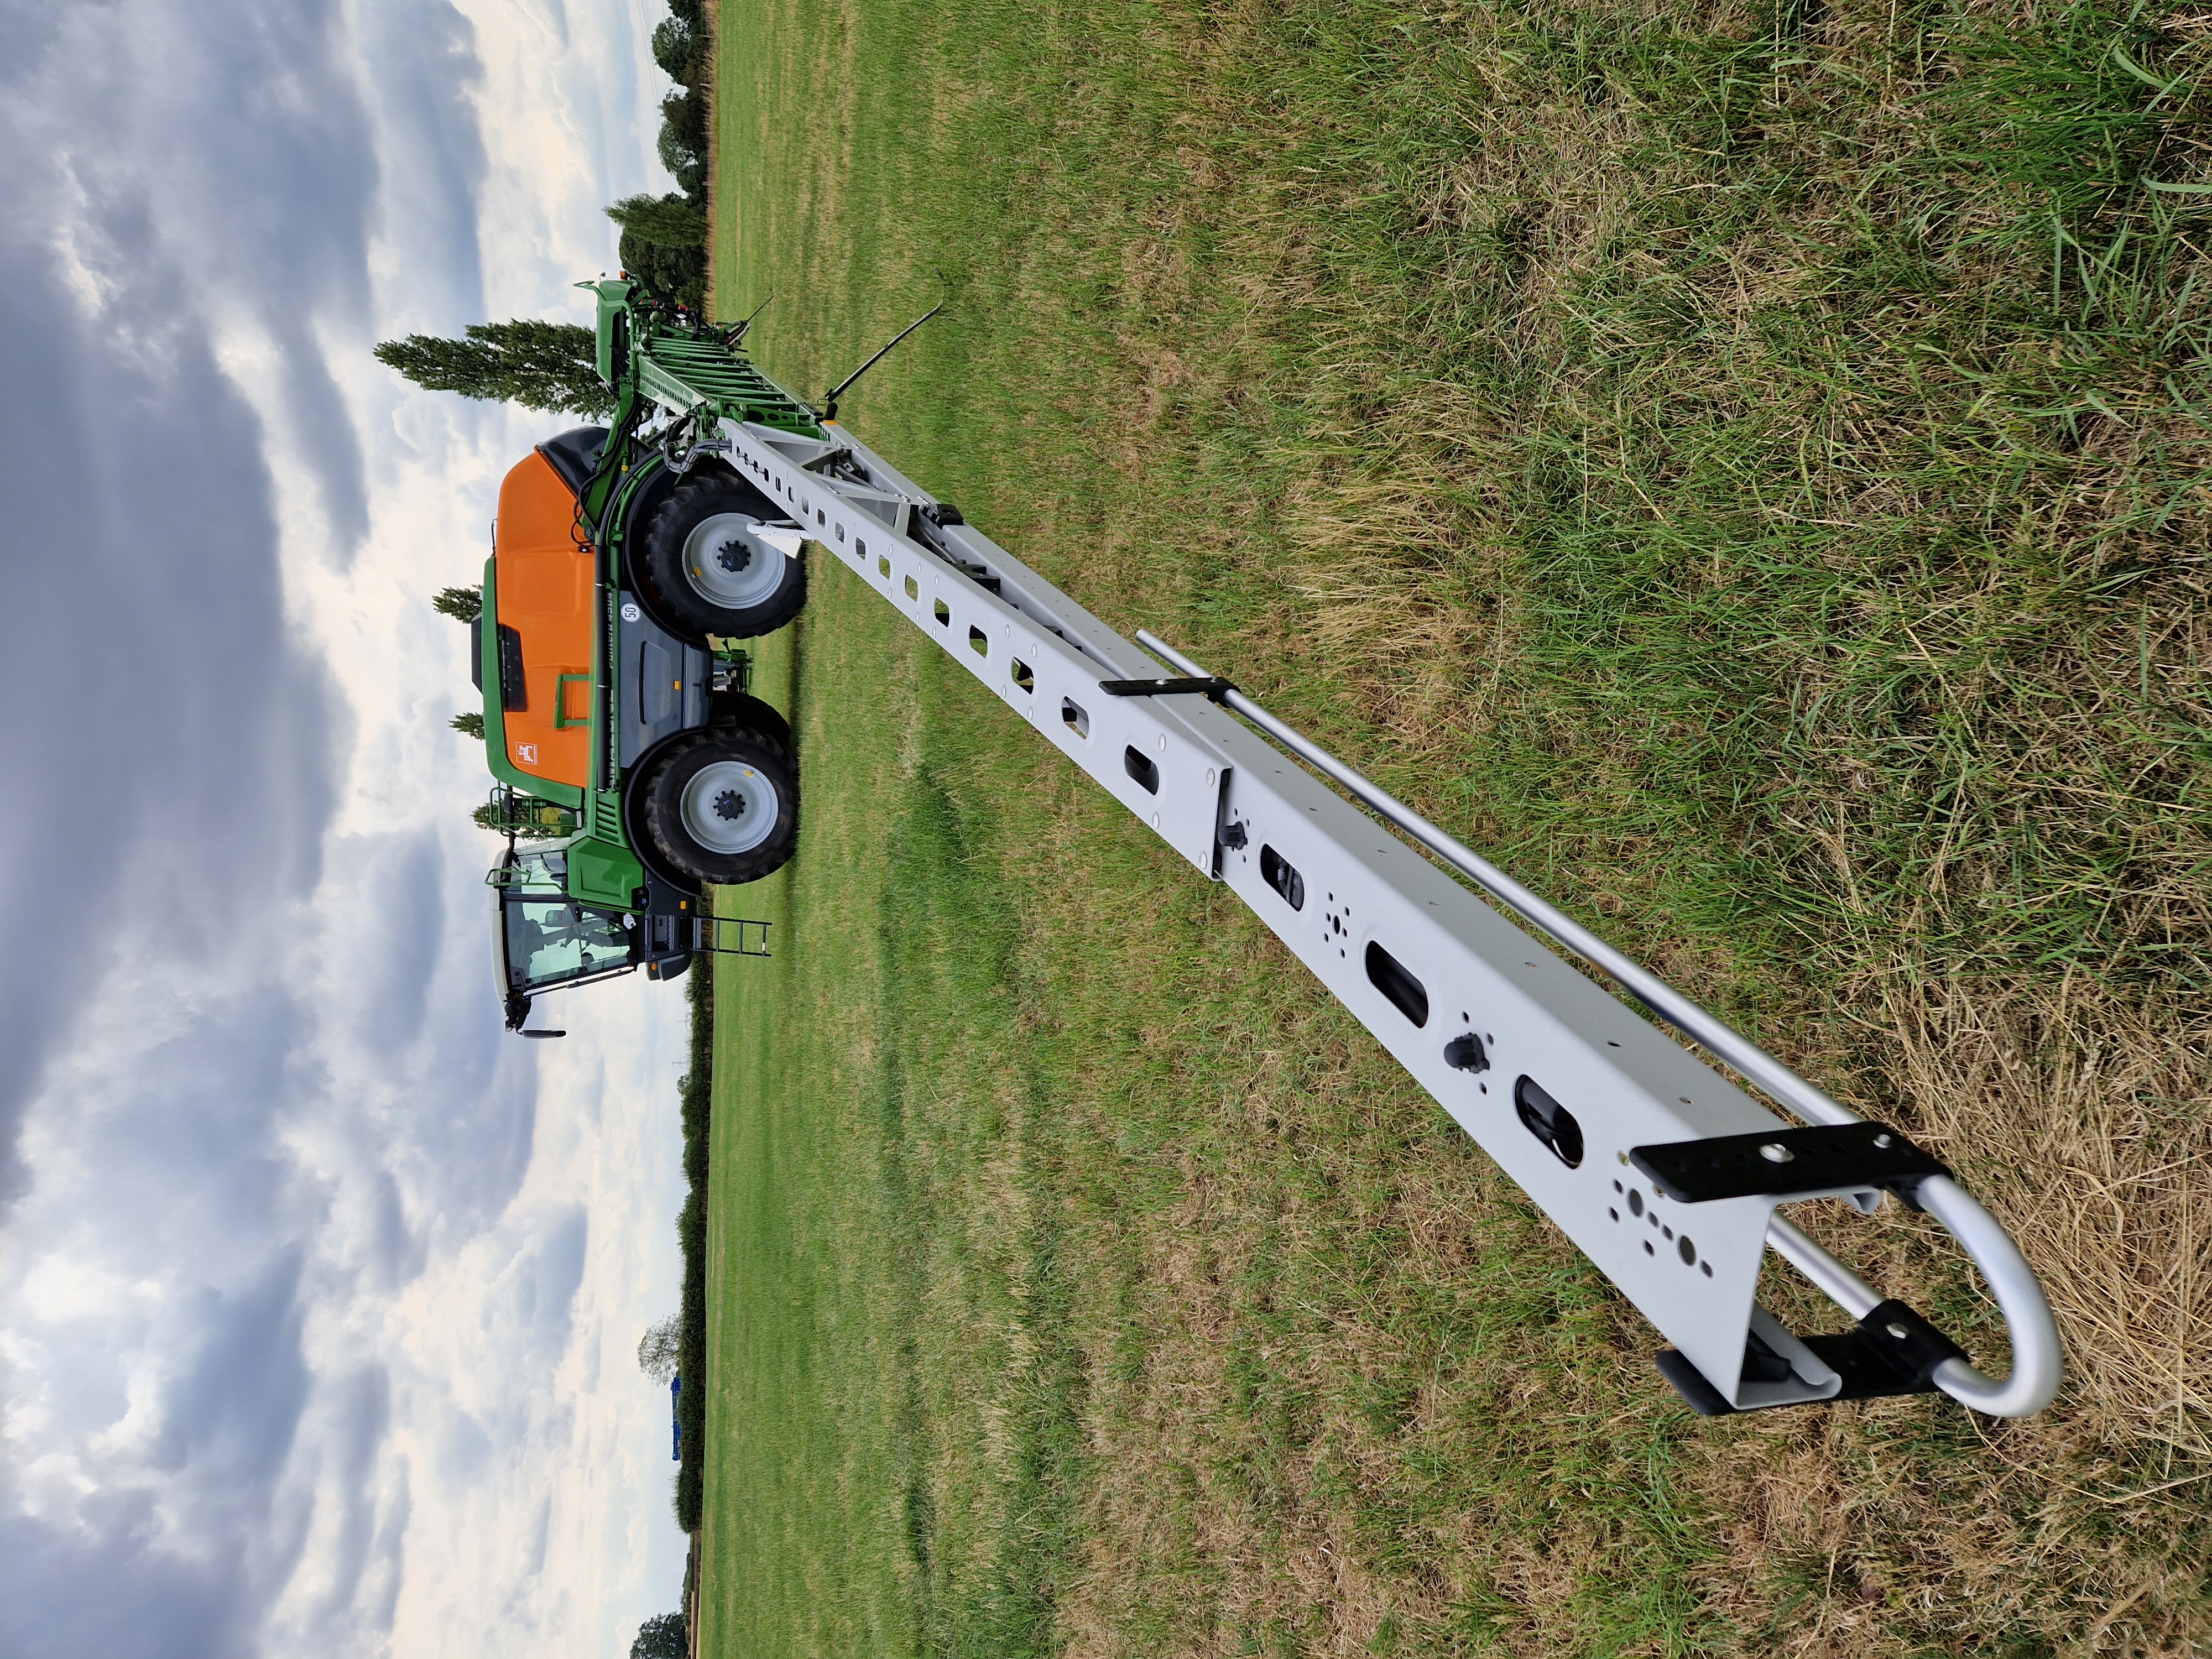
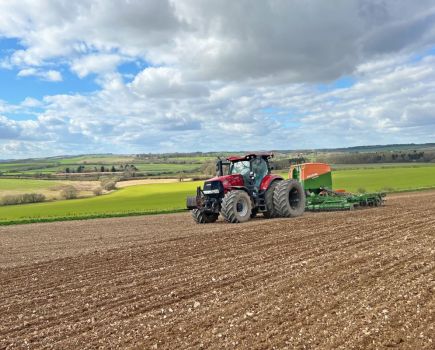
Some of the potential barriers for a small farm when it comes to adopting new technology have been overcome by a partnership with BASF, Amazone and Meteos UK. As an example, the self-propelled Amazone Pantera 4504 has enabled variable rate fungicide applications on the farm.
Fungicide timings were also refined by technology thanks to the Xarvio integration with a Meteos UK weather station. The company’s director David Whatoff explains that as well as taking the standard measurements of precipitation, temperature and humidity, the weather station has an additional solar sensor to measure light intensity and leaf wetness in the canopy.
“Bringing this data really does bring life to decision support and disease modelling. This additional information is needed to help understand pathogen development in the crop,” explains David. “Light intensity is key for rusts, which use the energy from light to be able to proliferate across the leaf surface. Having that measurement of light intensity allows us to understand how much opportunity that pathogen has had to develop within the crop.
“The leaf wetness sensor is integral to decision-support, particularly for fungal diseases which are spread by rain splash or develop in damp, humid conditions. Understanding the microclimate in the canopy helps you do this, for instance, septoria requires 14 hours of leaf wetness to proliferate so this sensor can highlight when those conditions have occurred in the crop canopy.”
The weather data can also be used to measure the growing day degrees the crop has experienced which can be used to assess its development /growth stage. The data is transferred by 4G to the cloud every 10 minutes where it can be pulled into xarvio by API.
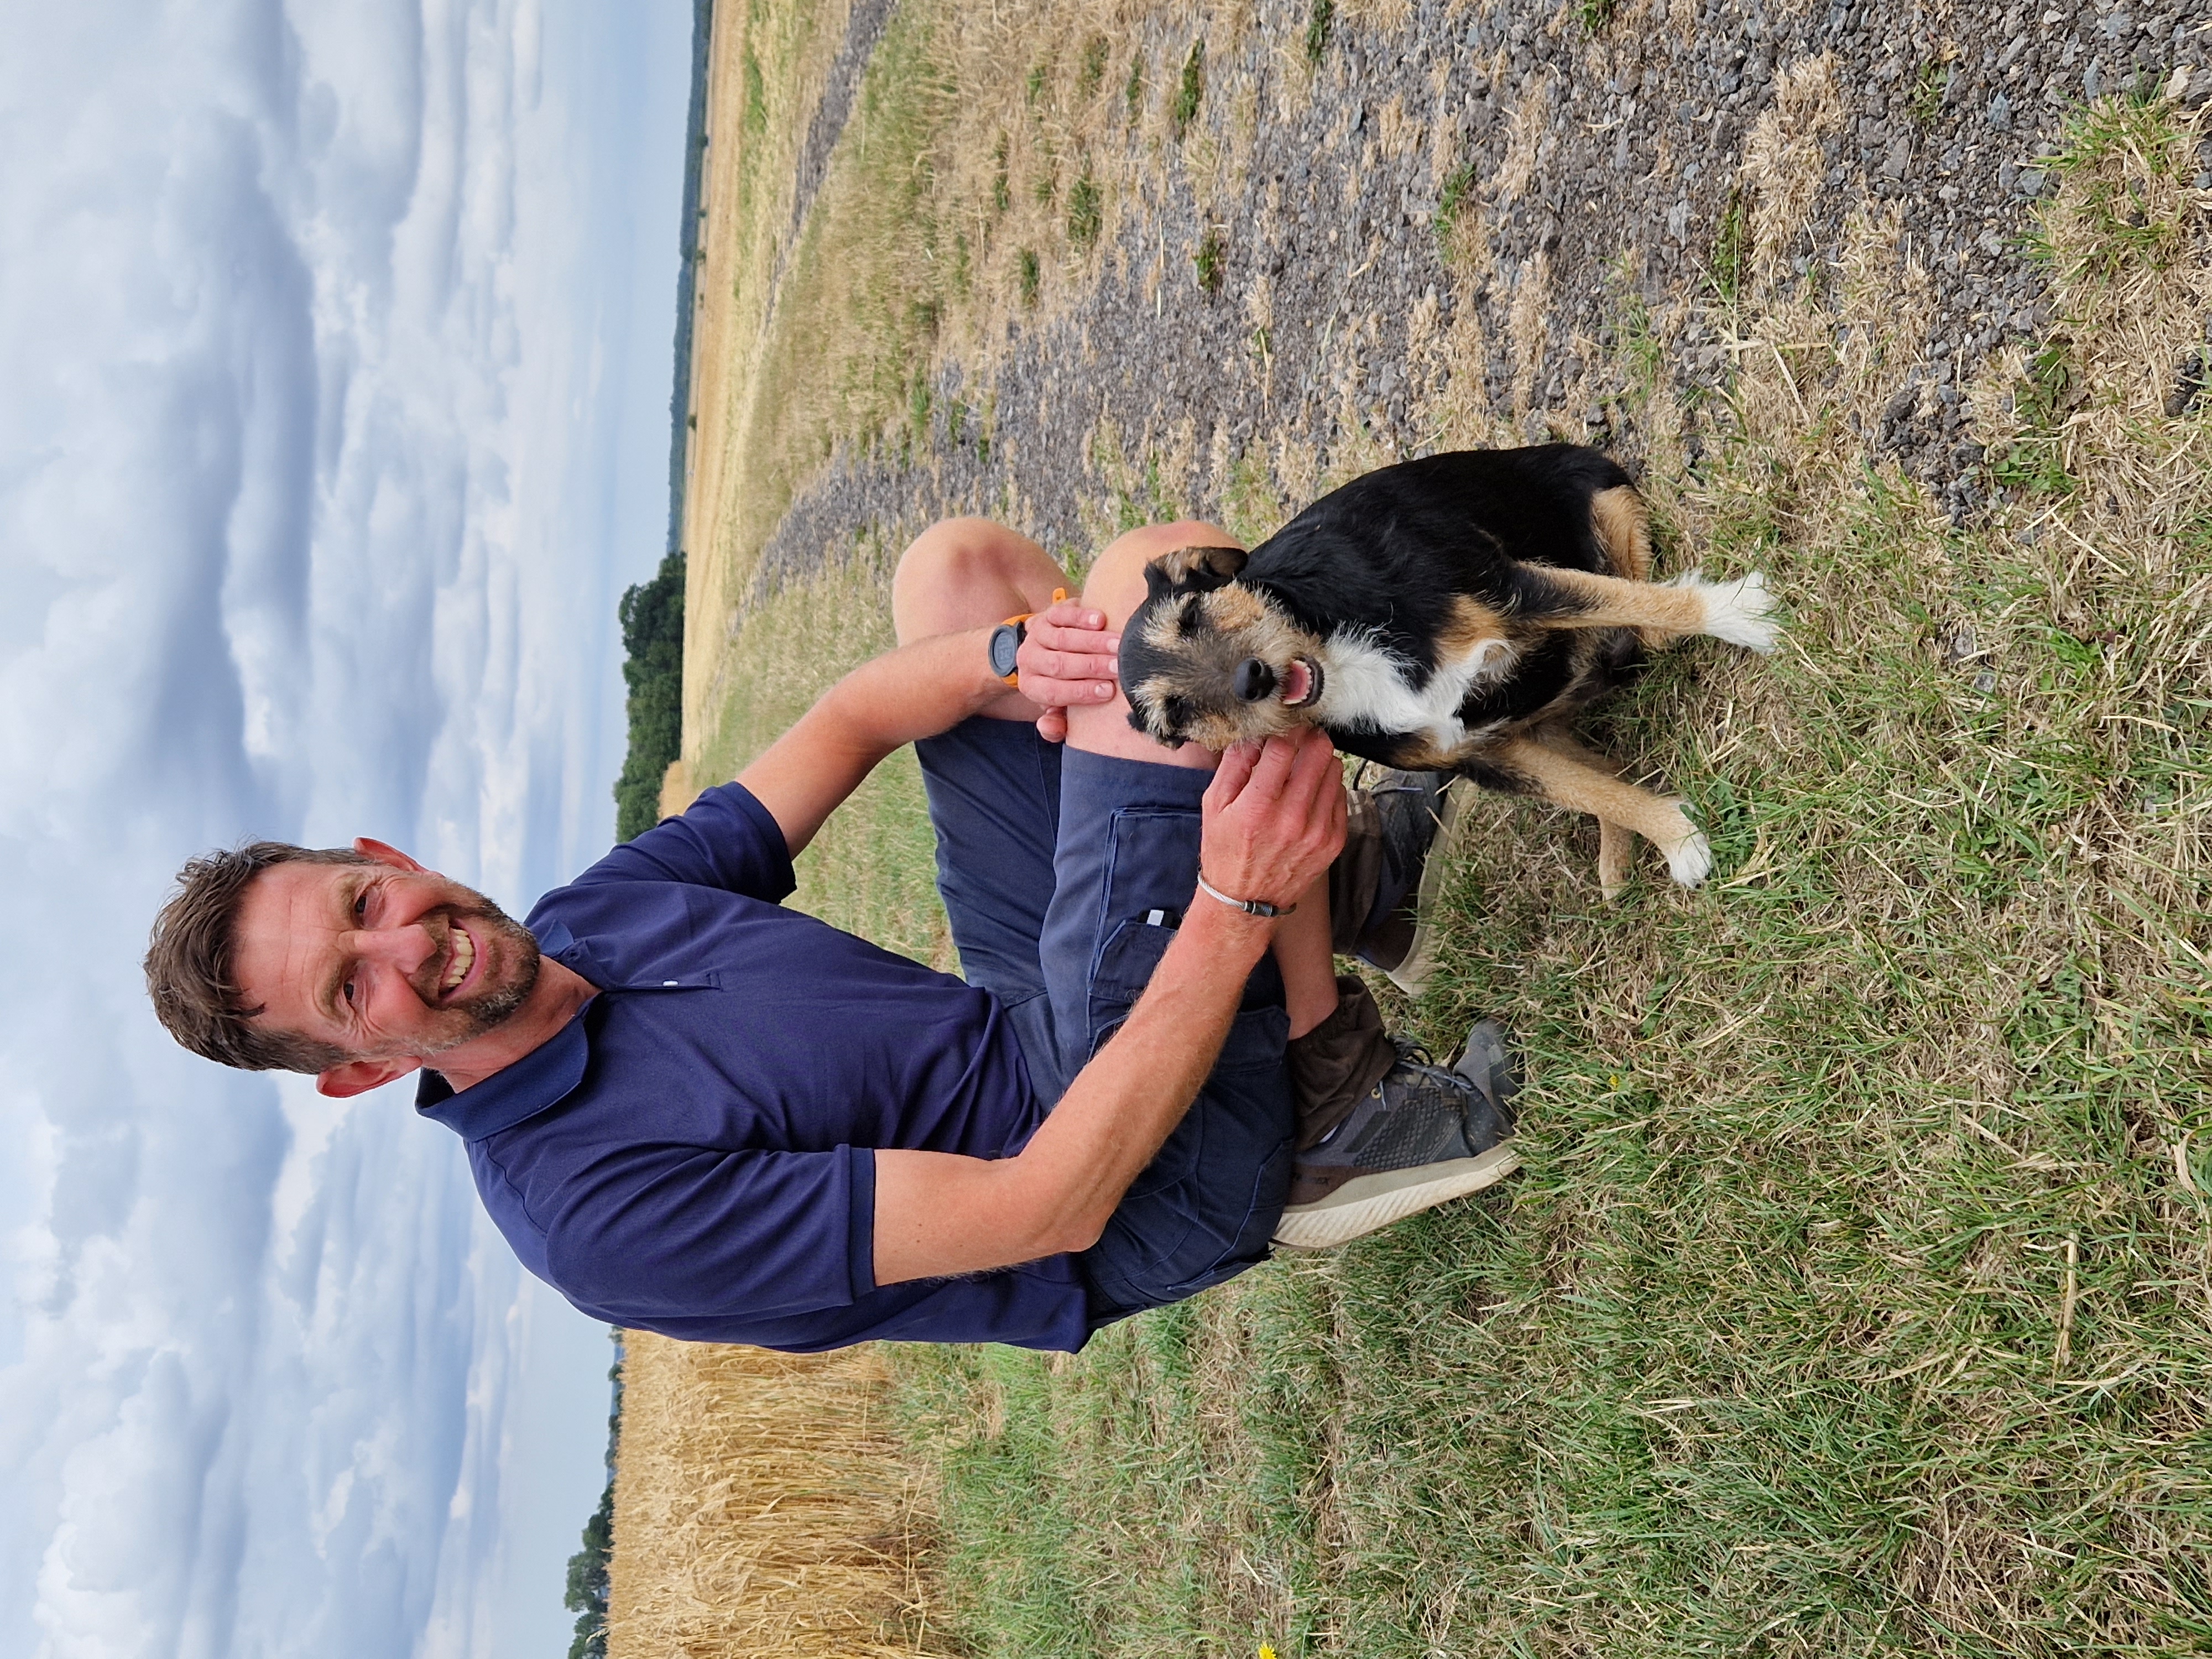
Pat Thornton (pictured with Sidney) believes that you can’t keep doing the same thing and expect a different result, but he isn’t adopting change for the sake of it – it has to pay.
Pat says the growth stage indicator in Field Manager has been “annoyingly bob-on.” Last year he made a decision to go in with a T1 spray at the timing he thought was right and it proved not to be a good decision, he recalls, “xarvio was actually correct.”
So did varying the inputs have the desired effect? The combine was the judge of that and showed that the majority of the field (60%) yielded 9.25-10.1t/ha, with poorer areas predominantly on the headlands bringing the overall average down to 8.53t/ha, with specific weights from 78-82g/hl.
“I’m no teenager but I’m not a luddite [when it comes to technology],” smiles Pat. “I find xarvio very intuitive to use, it’s just enough and I can scale it to be practical and add value. And all without information overload.
“Efficiency of the things we do is becoming more important with the pressures of decreased BPS and increasing costs, so I can see the value of xarvio. It’s almost a justification of what we do and coming back to the ‘why’ question, it will save me money and I can see the return on what I invest.
“I want to embrace new technology, it’s becoming the norm but it doesn’t dumb down any skills we already have. A lot has been lost in what we do, including understanding the soil, and for me, xarvio acts as a useful aide memoire,” concludes Pat.
Footnote: For a more in depth look at Pat’s xarvio trials see CPM May 2022, page 30.
Omnia steps it up
Since 2016, Hutchinsons’ Omnia platform has progressively been bringing more technical tools to the digital farm toolbox, and now it’s introduced a Business Performance Planning tool.
The web-based farming tool originally set out to provide a product that could import and use data from any source, so users weren’t limited to using a particular programme to gather information, explains head of Omnia, Oliver Wood.
“When Omnia started it was about variable rates and precision farming, but over the past 12-18 months it’s evolved to include tools that are whole-farm based and it’s now also about helping farms become more digital.”
Omnia includes crop and yield mapping, MyJohnDeere connection, TerraMap, Greenlight Grower Management, Claas telematics, its own Scout app, field performance analysis and carbon mapping, among other tools. And earlier this year it launched its Soil Management Plan tool, to help with multiple aspects of the soil-based standards within the Sustainable Farming Incentive (SFI), including VESS test scores (Visual Evaluation of Soil Structure) and erosion risk mapping.
Now, with the launch of its Business Performance Planning tool, Omnia aims to give growers more insight into the possibilities and opportunities on their farms, explains Oliver. This new module allows for full farm rotation planning, cropping and mechanisation scenarios, calculation of the CO₂-equivalent and financial performance of each scenario as well as full mapping of scenarios.
“The tool is an industry first,” he states. “Growers can use it to look at their rotation and digitally change them to see what effect this would have, including how it could impact machinery use and costings. You can use it to assess the overall net margin of each scenario, and it can help you prepare your CO₂ emissions.”
The Business Performance Planning tool in Omnia puts in simple functions that will help inform decisions, carbon status and cost up capital expenditure on farms, explains Will Foyle.
According to Will Foyle, farm business consultant at Hutchinsons, Omnia’s new tool has come at a pertinent time. “The economics of different crops has changed a lot, largely due to their fertiliser requirements and people are looking at their rotations in new ways. Growers are being more fluid with their rotations instead of having a set default and, although there’s more fluidity, there’s still a lot of uncertainty about which crop is the right one to grow.
“This tool allows them to fully plan and cost up difference scenarios. It lets users calculate this for their farm and to determine their ability to grow different crops. With changes in cropping and – for some – a return to oilseed rape, this is important.”
Users can now also use the platform to factor in potential purchases and how these could impact the farm’s net margins. “There are government schemes out there, such as the popular Farming Equipment and Technology Fund, which help farmers buy implements; one tool that a lot are investing in is a direct drill,” says Will.
The grant supplies 40% of the total cost but growers still need to pay the remaining 60%. “The platform can help with the maths to see if this 60% outlay is the right choice for your farming business.”
A further management aspect users may be able to take advantage of using the tool is to scope out alternative land uses on farm, says Will. “It’s beneficial for growers to understand their land’s performance at a field level and at sub-field level. This can give them confidence that they are making the most of their assets.”
The platform should also be able to help growers integrate aspects of the SFI now it has been launched, adds Will. “Growers can use the tool to identify and perhaps remove the worst performing parts of the farm from the current rotation. The scenario planner can show whole fields, and certain areas of fields, that might return a healthy margin on a first wheat but might be marginal on a break crop – so perhaps better suited for integrating short-term options through Countryside Stewardship schemes or SFI.
“It’s a complicated picture farmers are faced with,” says Will. “But with the platform we’re trying to break it down step-by-step and put in simple functions that will help inform decisions, carbon status and cost up capital expenditure.”
To demonstrate how the Business Performance Planning tool can be used, Omnia has created a scenario on its virtual Helix farm to see how buying a direct drill could impact margins. “Users can see if the change would reduce their capital exposure,” says Will.
The scenario includes receiving a 40% government grant towards the cost of the drill and then using the tool to justify the investment of the remaining 60%.
In the first scenario, the tool calculated the net margin over five years (2023 to 2027), based on the same yield as the existing system – which had a net margin of £107,376 – after introducing the direct drill. In this instance, the net margin increased significantly to £133,284, explains Will.
The second scenario factored in a 5% fall in yield due to the introduction of the direct drill and calculated a net margin of £102,820.
The final scenario included a 10% loss in yield compared with the current system which resulted in a net margin of £75,257. “Growers can use this to compare different impacts on yield to see how much change the farm business can sustain,” he adds.
This article was taken from the latest issue of CPM. For more articles like this, subscribe here.