Grain nutrient benchmarking could reveal new ways to improve nitrogen use efficiency. CPM explores what it is and why it could influence your next fertiliser order.
Every kilogram lost represents a financial loss for growers and an environmental burden.
By Tom Allen-Stevens
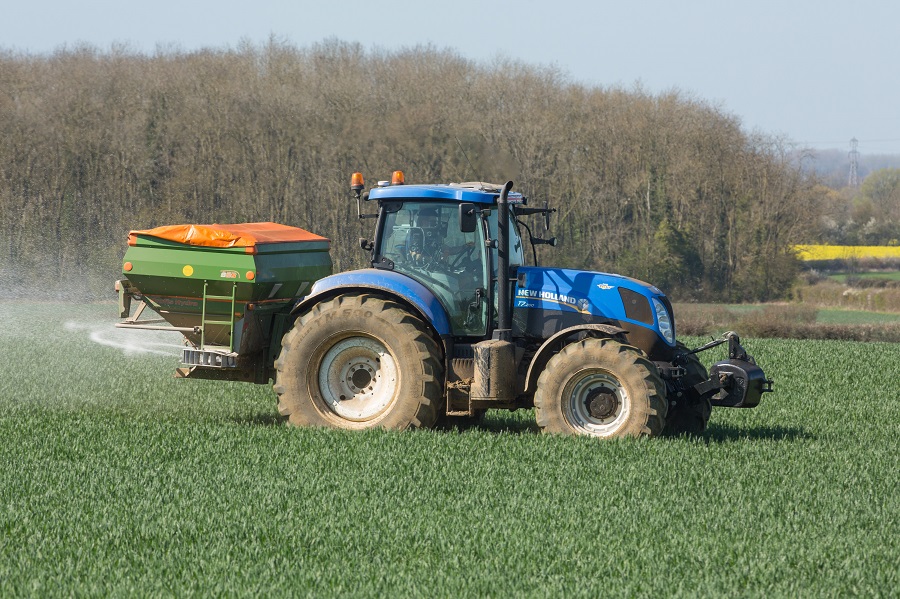
How many tonnes of nitrogen-based fertiliser has fanned out behind you as you’ve applied it to the crop this year, and how much of that has actually been taken up by that crop?
There’s a good chance more than half of it never actually made it into the growing canopy, let alone into the emerging ear, according to Yara’s Mark Tucker. “While the best growers in ideal conditions achieve up to 80% nitrogen use efficiency (NUE), it can be as poor as 35%, especially when soil conditions are compromised, as they have been this year. But every kilogram lost represents a financial loss for growers and an environmental burden.”
Mark feels that this time of year, just before you set about deciding your fertiliser order for next year, is the opportune time to assess how you source and how you apply the key elements of your crop nutrition.
“Perhaps the first decisions to make relate to the source of the N – whether that’s solid or liquid, combined with other essential nutrients, such as sulphur (S), potassium (K) and phosphorous (P), and importantly whether it’s based on urea or ammonium nitrate (AN).”
That’s come to the fore recently as the government is poised to legislate on ammonia (NH₃) emissions. This has already progressed in Germany where it’s now illegal to apply uninhibited urea-based fertilisers. NH₃ causes a problem because the natural process that converts urea to plant-available N results in some NH₃ volatising, especially if the urea isn’t washed into the soil shortly after application.
Extensive, Defra-funded trials established that ammonia losses to the air from N applied as uninhibited urea averaged 26%, compared with AN at 3%. It’s a source of particulates which can impact on human health, and with agriculture responsible for 88% of the total NH₃ emissions in the UK, reducing these is one of the main objectives in Defra’s draft Clean Air Strategy.
While losses from AN to the air are minimal, nitrate from AN is more prone to leaching into water courses, notes Mark. “The critical aspect is to ensure an accurate application rate – 50% of what’s not used by the crop will wash down your drains.”
While you can’t control the weather, you can tailor N inputs closely to crop requirements, and that can have a significant impact on NUE, he adds. “Taking control of your crop’s nutrient requirements boils down to a focus on three key areas – the soil, the leaf and the grain. Now’s the time to measure what’s actually ended up in the grain.”
Mark advocates a post-harvest grain analysis to assess the levels of key plant nutrients, followed up with grain nutrient benchmarking with other growers to help identify points in the nutrition programme where improvements can be made.
“This is a relatively new way of reflecting on how successful your nutrient management has been and has been developed through the Yield Enhancement Network (YEN),” he notes. “Grain nutrient benchmarking prompts you to question whether you applied an appropriate amount of N and helps you put in place an action plan to refine your strategy.”
The AHDB Fertiliser Guide, RB209, provides guidance on how much total N to apply, depending on expected yield, he explains. “If you applied enough for a 10t/ha crop, but only achieved 8-9t/ha, for example, there’s likely to be surplus N left in the soil – the best way to capture that is to establish a cover or catch crop soon after harvest.”
But the grain analysis can give more insight. Mark recommends growers take at least one representative sample per wheat field. “A high grain N is another indication that there’s likely to be surplus N, especially if yield was lower than expected.
“If the grain N is low, that means the crop’s potential has been limited, which may be related to end-of-season applications. It can be a particular problem in high-yielding bread-making varieties, where not enough N has been channelled into providing the required protein in the ear,” says Mark.
“A low grain N is also a good indicator of poor N capture due to under supply, while a high grain N indicates something other than N was reducing yield. There are a number of nutrients a wheat plant needs to process N and synthesise grain protein efficiently.”
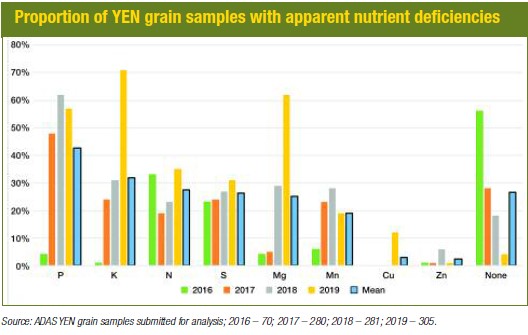 Evidence from grain samples gathered from YEN growers over the past four years reveals quite common deficiencies in both macro and micro-nutrients. From a total of 936 samples, 74% of cereal crops appeared to be deficient of at least one nutrient.
Phosphate has shown itself as the nutrient most commonly lacking, with an average of 43% of samples deficient, notes Prof Roger Sylvester-Bradley, head of crop performance at ADAS. “Over 80% of the P that a plant takes up is transferred to the grain at harvest – the highest proportion of all nutrients – and YEN data show positive relationships between grain P and yield,” he says.
“But the YEN figures suggest that a healthy soil P index does not guarantee that a plant will access the nutrient successfully. Grain P analysis augments what the soil P result tells you as it assesses uptake as well as supply.”
Roger points to a further analysis of the figures in which grain and soil analyses of YEN samples were combined. “12% were low in both, but only 36% showed sufficient P in both soil and grain. The highest proportion – 46% – had adequate soil P but low grain P. That indicates something’s wrong with P uptake, which is probably holding back yield.”
Magnesium (Mg) and K also showed up last year as nutrients that were low in a high proportion of samples, while S and N have shown up as consistently low across all four years in more than a quarter of samples, he says.
“With N, you’re looking for a level of about 2% in the grain for a feed wheat. This is directly related to the grain protein content, and the target value varies according to variety and market. You can calculate target grain N by taking the protein content shown on the AHDB Recommended List and dividing by a factor of 5.7. So you’d want 2.4% grain N in Crusoe destined for milling, while 1.9% would be adequate for SY Insitor.”
Roger notes that there’s varied confidence in current assumptions about critical grain nutrient contents. “Some nutrients such as P have more research behind them than others, such as K.
“Wheat needs at least 0.3% P and anything below 0.25% will certainly result in a yield penalty. We’re most confident about these values as they’re based on 10 years of independent research. YEN results show that good soil P values alone do not guarantee that your crop is getting adequate nutrition.”
But the fact that there are many deficient crops with several possible deficiencies should be a cause of some concern, he feels. “That’s why bench-marking is a very valuable exercise. We’ve learnt through YEN how it shows up for individual growers specific deficiencies that warrant investigation, as distinct from deficiencies due to unavoidable seasonal factors, as well as nutrients that could be a problem on a wider scale. Then, through sharing experiences with others, we can identify practices that could improve performance.”
ADAS is now launching a new service, based on grain nutrient benchmarking. The aim of YEN Nutrition is to support growers seeking to improve the nutrition of arable crops. For £250 you get levels of 12 essential nutrients for six separate grain samples. Benchmarking reports will augment results of soil analysis and reveal which nutrients may have affected crop performance.
So what does Roger feel may be holding back growers who aren’t getting sufficient nutrition into their grain? “It’s interesting that most of the winners of YEN use organic manures alongside fertiliser applications to get the best from their crops,” he notes.
“But the biggest difference between top-performing wheats and those at or below average comes down to what we call the ‘farm factor’. Those growers who apply a little more attention to every aspect of their crop nutrition generally tend to get the best results.”
Yara agronomist Natalie Wood agrees there a number of aspects that contribute towards getting greater value from the nutrition you apply. “Don’t use grain nutrient benchmarking alone to figure out your nutrient strategy,” she notes.
“While it’s a useful tool it’s best combined with other field knowledge such as soil and tissue results to really start to build a picture of your field and farm. Try also to take grain samples that can be related back to either soil results or specific management practices, such as micronutrient application, so you can gauge the impact of those practices.”
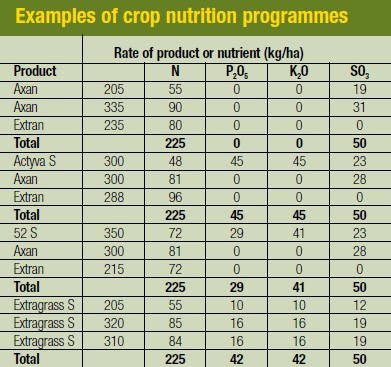
The best way to ensure crops have the balance of major nutrients they require is to apply these as compound NPKS fertilisers in the spring, she advises. “A crop takes up sulphur in proportion to the N it takes up, so the best way to apply it is little and often with the N.”
P and K demand reaches a peak in the spring with 70% taken up in a 4-8 week period. “Soil availability of P is at its lowest when spring starts, and winter rain will have moved K down through the profile, so compound products applied in spring give the crop the readily available P and K it needs,” explains Natalie.
‘Usual culprits’ deficient in leaf tissue sampling results
Initial results from tissue sampling of crops this season have shown 85% are low in boron (B) and almost three quarters of samples submitted low in magnesium (Mg).
“It’s the usual offenders that have been the ones with highest deficiency scores,” reports Yara’s Natalie Wood. “Along with B and Mg, copper (Cu) has been found to be low in 57% of samples and zinc (Zn) at 67%. We see the same deficiencies year on year which suggests the management of these nutrients tends to be routinely overlooked.”
An Mg deficiency can cause a high yield penalty as it’s an integral part of chlorophyll, so it impacts directly on photosynthesis capability, she explains. “Many growers regularly apply manganese as field history often suggests it’s a nutrient that falls short. But this is the time of year that’s key for building the yield through light interception, and Mg is a key part of ensuring the crop can do that as efficiently as possible.”
Any deficiencies shown up in tissue tests can be rectified with a micronutrient application at the T2 spray timing, she says. “Late drilled winter crops have had less time to generate the number of tillers that you’d want for optimum yield, which means fewer ears, and it’s clearly too late to influence that. You can use nutrition to influence the number of grains/ear, however, which will maximise the potential yield back from the low tiller numbers you have.”
Wheat crops destined for milling can benefit from a ‘top-up’ application of 40kgN/ha nitrogen, she says, such as liquid Nufol (20%N) or solid YaraBela Axan, while this can also extend pod photosynthesis in oilseed rape. “An application can help ensure a milling wheat crop has enough N to get the protein into the ear. If there’s enough soil moisture, a solid application can be made until just before ear emergence, while liquid should be applied at GS 69-75.”
Test yourself on fertiliser efficiency
Are you at the top of your game on fertiliser practice or are there still some elements that can do with improvement? Yara has a quick quiz on its website that lets you know from answering just five questions www.yara.co.uk