In a world where it’s more important to focus on tailoring applications to in-field variance than getting it right on average, digital precision becomes an essential. CPM reviews Yara’s Farmer toolbox.
It’s easy to make a complex tool but more complex to make it easy to use.
By Tom Allen-Stevens
In an average year, the normal way to decide how much fertiliser to apply would be to look at your five-year average yields and cross reference these with tables in the Nutrient Management Guide (RB209) that gives you a long-term average rate to apply across your fields.
“But when was the last time you had an average year?” asks Yara’s Miles Harriman. “RB209 is a great guide to the long-term average, but when it comes to applying fertiliser, it’s more helpful to focus on how much your crop is differing from the average. That’s where digital tools come in.”
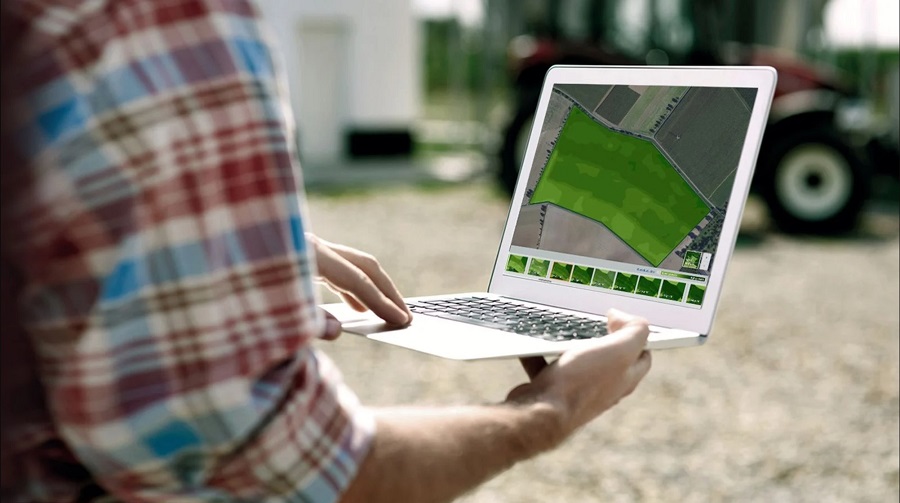
Yara has relaunched its digital tools for spring 2021. The key components have come together in one platform – Atfarm, accessed by simply typing “at.farm” into your web browser. There are three core elements of Atfarm that have come from Yara’s Farmer’s toolbox – the company’s collection of digital tools and services:
- Atfarm – Existing users of this online service will be familiar with the map-based application that allows you to draw or import fields, stored in your account, and view satellite imagery for free, while subscribers can generate application maps. This now becomes the central hub for all your data.
- N-Tester – A hand-held unit, available on subscription, that measures the chlorophyll content of a crop leaf, giving an accurate guide to the plant’s nitrogen requirement. It links via Bluetooth to a smartphone app, which now sits within Atfarm.
- YaraIrix – a free smartphone app that allows you to measure the nitrogen demands of your crops at different growth stages through uploading pictures. The app, which also sits within Atfarm, provides variety-specific N recommendations.
“Atfarm brings all your crop-monitoring data together on one easy-to-use platform,” explains Miles. “Existing users will find their monitoring and application history is all available in one place. What it provides is dynamic reconciling of optimum nutrient demand using land and satellite-based tools – it makes it easier for growers to improve their nitrogen use efficiency (NUE) through the growing season.”
Miles stresses three important features of Atfarm. “It’s accurate, quick and easy to use.”
Atfarm is based on algorithms developed for the N-Sensor, Yara’s premium-level precision farming tool, originally launched in 1999. This is a variable rate sensor unit that sits on the tractor and measures crop nitrogen requirement at the time of application. It variably adjusts the fertiliser rate accordingly in real time, using its own light source so it also works at night, and being land-based rather than satellite-driven, it’s irrespective of cloud cover.
“Yara has developed its own algorithms over the past 20 or so years that have been exhaustively trialled and tested to the point it will reliably apply an absolute N rate, determined entirely by the crop cover – you don’t even have to calibrate the unit or provide minimum and maximum values,” says Miles.
“The N-Sensor uses slightly different wavelengths from the standard NDVI (normalized difference vegetation index) used by most devices, making it the most reliable and accurate sensor on the market.
“The same powerful algorithms are available through Atfarm, making it the most accurate satellite-based service for generating application maps. The difference is that Atfarm is lower resolution, and will use only the most recent satellite image available, which depends on cloud cover.”
Ease of use is an aspect Yara pays particular attention to, says Miles. “There are so many digital tools available to farmers. While they may be great apps, you get lost, and need a level of innate digital skills or instruction to get the most from them. It’s easy to make a complex tool but more complex to make it easy to use.
“We believe on-farm digital tools should be like the iPad – you shouldn’t need an instruction manual but should be able to use it intuitively. We have over 300 engineers, coders and designers working worldwide on our digital tools. They have one core aim: make the user interface (UI) simple. These aren’t usually tools you’ll use every day, so they must provide a quick route to the information you want. We carry out a lot of user-feedback studies to improve the UI, and these suggest Atfarm scores very high.”
The N-Tester BT has been used in the field for around a decade to give an accurate measurement of how much nitrogen a crop has taken up. The unit consists of a photosensor and light source that’s clipped to a leaf and measures chlorophyll content. The current version has no display but relays the information by Bluetooth to the Atfarm app where data is processed.
“We’ve been looking at low-cost alternatives, such as a simple clip that uses a phone’s own light source. But this relies on phone hardware which varies. What’s more, the bulk of the cost is the calibration and algorithms, rather then the unit itself,” notes Miles.
Out in the field, it can be used for crop monitoring (from fortnightly to weekly) or as a nitrogen recommendation tool for winter cereals, explains Yara agronomist Natalie Wood. “You take a representative sample from a field – a bit like soil sampling – and need at least 30 leaves. This gives you a three-digit reading – 700 and above suggests the crop has enough N, while below 650 means it’s probably time to apply.”
The Atfarm app processes the data. “With all your crop information in one place, you’ll already have the history. The app needs to know crop, variety and whether it’s a milling crop to calculate a recommendation at growth stages 37 to 51.”
Natalie notes that loading fields into Atfarm is easy with the ability to import them as shape files or draw them onto satellite photos using the intuitive app tools. “Growers tell me it takes just a few minutes to set up all their fields. Atfarm pulls in the latest satellite data, which depends on cloud cover, to give you the NDVI biomass, useful until canopy closure, or N-Sensor biomass, which shows variability across all growth stages.”
To generate an application map, you enter in the desired rate along with upper and lower limits and Atfarm produces a variable rate application (VRA) plan you can export to John Deere, Trimble, as a generic shape, ISO or pdf file. You can even use the Atfarm app on your smartphone as a VRA terminal.
So what sort of results can you expect? Over 200 tramline trials over many years have shown the N-Sensor brings yield increases of 3.6% on average to winter wheat and 4.4% on oilseed rape. While this may not seem much, the main advantage of the digital tools is that it puts the N in the right place, Natalie points out.
“With the N-Tester, you’re tailoring the amount you apply to what your crop is telling you it actually needs. In trials we’ve seen RB209 recommend 280kgN/ha while the N-Tester has trimmed it down to the optimum N rate of 160kgN/ha.
“Ultimately these tools can help boost NUE. While this also relies on getting the basics right such as in-field conditions, digital tools can bring your NUE as high as 75-80%,” notes Natalie.
The benefit of asking a crop what it wants
With predominantly clay loams in the Vale of York, newly appointed AHDB Strategic Farm North host David Blacker has been using the N-Tester for a number of years to fine tune applications to his wheat crop.
“It’s completely revolutionary compared with standard practice,” he says. “The N-Tester tells you how much the plant actually requires, which tends to be more gradual applications of smaller amounts then I’d usually apply. Typical applied rates used to be 220kgN/ha while these days are more like 160kgN/ha.”
He’s now part of a project run by Sustainable Futures, funded by Yorkshire Water, which is bringing around 15 farms together in farmer-led trials. Each will carry out split-field trials over an 8ha field, with half given the farm standard N recommendation, while the N-Tester is used to tailor dressings over the other half of the field.
“Each field receives a baseline, early dressing of 50kgN/ha, with rates varied at the later two applications,” he explains.
David uses the old version of the N-Tester with a read-out display and manually converts the figures into a recommendation. “Below 650 I know the crop’s deficient, while above 700 it’s fine. I’ve found it’s very reliable – they’ve obviously put a lot of work into calibrating it,” he notes.
“I tend to test as much as twice a week once the crop gets near the stage an application is needed. You have to bear the weather in mind – if it rains the crop will take up N, while if it’s unusually dry, the tester may indicate the crop needs an application, but it may be that it just can’t take up what’s there.”
He also finds it a good discipline to get into the crop and monitor it closely – an opportunity to spot any other issues. “One thing I’ve noticed is that the readings crash shortly after the crop receives a major spray application, such as the T1 fungicide, especially if some herbicide has gone in the mix. You can’t quantify it in yield, but I think we underestimate the stress this puts the crop through,” David adds.
Near Wooler, Northumberland, Martin Rutherford has 700ha of wheat at Tower Martin Farm. Soil type varies from mixed sandy loams to heavy clay, and this variation is frequently found across the field.
He uses the new N-Tester BT to help decide rates. “You have to take at least 30 samples to get a reading. You open up the app on your phone and it pairs up, no problem – it’s very easy to use.
“I’ll take a sample in a thicker area of the field, then repeat it in a thinner area. This is useful because it gives me my upper and lower limits for variable rate applications,” he explains.
Martin has an Agleader OptRx crop sensor he uses to variably apply N across his crops. “I’d say we’re using about the same N overall, maybe putting slightly less on our thicker crops as a result of using the N-Tester.
“The advantage is that you know it’s better utilised – you’re feeding the crop according to what it’s telling you it actually needs. That means we’re more reliably hitting the yield potential of our crops and there’s a good environmental benefit, too,” he notes.
Tools of the trade
The Atfarm platform is free to use for its monitoring and mapping services and available as a desktop app through your web browser as well as apps for iOS and Android smartphones. This lets you set up an account and enter an unlimited number of fields across different farms. The recommendations available through the app for uploaded photos (previously YaraIrix) is also free.
If you want Atfarm to generate an application map, you have to activate a subscription, costing £195/yr. The N-Tester BT unit is provided as part of an annual subscription, costing £245/yr.
Grow the future
Climate change, societal demands, changing consumer trends and not least the weather – one thing that’s certain about farming is that it’s anything but predictable. So the best farms must be efficient enough to grow crops both sustainably and profitably now and in the future.
Few aspects of crop production are more critical in this than a plant’s nutrition, which is why CPM has teamed up with Yara. This series of articles looks at some of the innovations coming into this area and the practical steps needed to ensure your farming system is set to grow the future.
With decades of evidence-based knowledge, Yara continues to be at the forefront of crop macro and micronutrient advice. Investment in technology has resulted in world-leading products that support in-field decision-making and precision nitrogen application.