February is the month where thoughts may turn to nitrogen for some backward oilseed rape crops, where soil conditions allow. CPM gathers some thoughts on getting the most out of applications.
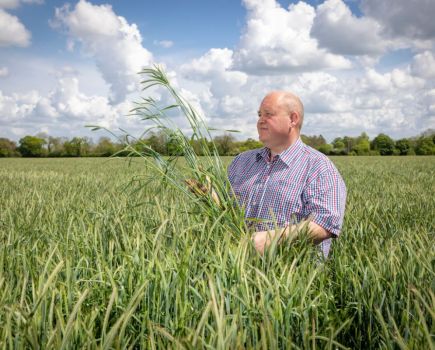
It’s worth checking how much N in the soil is going to be available to the crop.
By Rob Jones
You could be forgiven for flicking through the Guinness Book of World Records to see if fertiliser prices are featured. We’re facing the highest ever prices for nitrogen fertiliser, followed closely by just about the highest P and K prices, says Tim Kerr, Hutchinsons nutrition manager.
“This has come about as a result of volatility in the European gas market – natural gas is part of the production process of fertiliser. Just 12 months ago, 200kg/ha of nitrogen, plus 50kg/ha phosphate and 50kg/ha potash would have cost about £190/ha. Today it will cost over £500.”
However, this is nothing new in farming, he notes. “Exactly 100 years ago, the ‘Hadfield’s of Liverpool’ Fertiliser Diary for 1922 opened with a statement explaining that they had to turn away ‘hundreds of tonnes worth of orders’ the previous year due to unprecedented demand.
“Scroll forward to February 1952 in Westminster and the Ministry of Agriculture passed an act as part of the Agriculture (fertilisers) bill agreeing to pay farmers a 30% subsidy on phosphate fertilisers. This was due to the unexpectedly large increase in the price of fertilisers that year.”
Tim believes high fertiliser prices aren’t going away, with market metrics suggesting the industry should perhaps readjust its sights and be prepared to adapt to more costly fertiliser inputs for more than just this year.
“While history can provide some context to today’s situation, it’s more likely to be trial work and research that will guide us through the current situation.”
He says the current price spike means there’s a new economic optimum for nutrient management plans. As a starting point, Tim advises measuring the nitrogen in the soil. “Embedded within the fertiliser recommendations in RB209 are assumptions about the levels of N that the soil can supply,” he says.
“Where these assumptions are most likely to be accurate, and therefore not worth measuring, is where there are no organic manures being applied, no cover crops grown, or for soil types that are generally low in residual nutrition (typically light, free-draining soils).
“But when manures or cover crops are employed – or the soils are naturally fertile, it’s worth checking how much N in the soil is going to be available to the crop using the N-Min test.”
The result will provide a valuable insight into the quantity expected to come from the soil – potentially allowing for more precise N applications to fulfil crop requirement, he explains.
There’s no doubt that every grower will be revisiting fertiliser rates this year, agrees Dr Pete Berry, head of crop physiology at ADAS.
“In many areas oilseed rape crops are looking patchy due to variation in residual N in the soils, although crops generally aren’t looking as variable as they have in some years.
“The starting point is to measure how much N is in the canopy in the spring. Measuring the Green Area Index (GAI) will allow you to calculate the amount of N already in the crop – so you really know what you are dealing with before spring fertiliser applications. Most of the N supply in OSR is usually in its canopy, so assessing this is usually more useful than soil testing,” he explains.
“There are several apps and tools to do this but, as a rule of thumb, when looking at the groundcover, if there’s 50% cover then it equates to GAI of 1. If it’s 75% groundcover then GAI is up to 2,” says Pete.
“Typically you would expect at least one unit of GAI variation within a field – on this basis varying N by 80kg/ha would be acceptable, so for example rates ranging between 140kgN/ha to 220kgN/ha.
“If the GAI is high, over 3-4, then the crop possibly wouldn’t need any more N. We work on the basis that an extra unit of GAI is equivalent to an extra 50 kgN/ha in the crop, which means bagged N can be reduced by 80kg/ha (assuming an N uptake efficiency of 60%) which is equivalent to £160/ha at autumn N prices.
“For crops with a GAI larger than about 2.5-5 units, the best way of measuring them is to cut out the crop from a 1m x 1m area, weigh the fresh weight in kg, then multiply by 0.8 to get the GAI.”
So measuring GAI this spring will be key. NDVI imagery can give a good idea of biomass development, adds Tim. “Within fields there are often areas that perform badly – this will be backed up by the biomass maps and here you can choose to pull back on N. Using the guidance in RB209 – a 20kgN/ha reduction for every tonne of yield potential.
Measuring the nitrogen in the canopy is also useful, agrees Tim. “The Yara N-Tester measures the chlorophyll and uses this to interpret N levels in the crop. This provides a recommendation for how much more N is required.
“The N-Tester can be used once 100 kgN/ha has been applied – and the recommendations followed up to the optimum N rate that’s been calculated.”
Pete’s recommended plan of action for the spring would be to measure the canopy N and use this to estimate the field average N rate as accurately as possible, before calculating a variable rate for application.
“The break-even ratio is normally about 2.5:1, so if this goes higher, say 4:1, it’ll be worth reducing the RB209 recommended rate by 50kgN/ha. Do use the new AHDB calculator for estimating the break-even ratio of your crops (www.ahdb.org.uk),” he suggests
“OSR lends itself to variable applications because it often has large differences in canopy across a field and it’s relatively easy to measure this. The benefits of a variable N approach are expected to be greatest for the most uneven fields and are likely to be more this year because the costs of applying the wrong N rate, both in terms of N cost and yield value, will be high.”
There are also quality considerations, highlights Pete. “There are consequences if overapplying N, as this will reduce the oil content slightly,” he notes.
“It’s worth testing variable N approaches using tramline trials to see what benefit it gives on your fields. It’s important to measure both the yield output and N inputs on the variable rate and standard flat rate strips to enable the gross margin to be compared.”
Liam Wilkinson, arable technical officer for breeders Limagrain UK, says that modern OSR canopies are generally bigger but there’s a better understanding of the components of yield and how best to manage nutrition, and this has changed drastically within a lifetime.
“Thirty years ago there was the perception that there was no advantage to splitting doses. Applications should be much more targeted, and this must start with knowing how much N is in the canopy to begin with.
“Varieties being bred today are generally more vigorous in the autumn, drilling also tends to be earlier – leading to larger canopies. However, it’s important to understand how different varieties grow and establish themselves to ensure that they’re getting the nutrition they require, at the right time.”
He explains that every variety is different. “Some varieties can be very fast to establish but may slow down later in the autumn, whereas others take a bit longer to get going – but once their roots are established, they keep growing later into the autumn.
“For example, if the variety has a high autumn vigour, such as LG Aviron or Ambassador, and comes into the spring with a thick, well-established canopy, then it would be sensible to reduce the earliest N split as this will slow down stem growth. But remember if reducing N, be careful not to omit the crucial sulphur application.
“Varieties such as LG Antigua and Aurelia establish and put on biomass well in the autumn, which means that they get up and away quickly. But then they tend to sit in the winter, so their canopies don’t get too big. So, it’s important to treat each crop on its own merits.”
Liam highlights the importance of nitrogen-use efficiency (NUE). “While it’s all about aiming for the GAI in the spring – the key this year will be in using N as efficiently as possible by looking to apply only as much as the crop needs and applying it in conditions when the plant can best take up N,” he suggests.
He refers to previous work by the AHDB that shows that, on average, only 60% of the N applied is taken up by the crop. He advises growers to consider how to target applications better to improve on that, he says.
“NUE ultimately is around how much of the applied N is converted into harvestable yield. Meaning that genetics are key to this by mitigating any potential for yield loss.
“The combination of genetic traits such as TuYV, pod shatter resistance and robust disease resistances all help secure yield and means more of the N applied ends up as a saleable product come harvest,” comments Liam.
“Pod Shatter is a really significant factor when considering NUE as it’s all about the amount of N used for the actual amount of grain in the trailer. So for varieties without pod shatter, the NUE will be lower because any seeds lost as a result of weather or combine damage are ultimately wasted N.”
Residual soil N reserves matter
A series of national farms trials, carried out by CF Fertilisers, Agrii and Frontier, has shown CF N-Min is the most accurate method of measuring soil N reserves by a significant margin when compared with simple soil mineral nitrogen (SMN) testing or using RB209.
The trials took place across nearly 50 farms, representing more than 20,000ha of UK arable production and concluded that CF’s soil N-Min field test accurately predicts soil N reserves in nearly 80% of cases. This compared with 45% accuracy with SMN and just 33% with the RB209 Field Assessment method.
“These are critically important results,” says CF head of agronomy Dr Sajjad Awan. “At a time when all producers are being asked to be as responsible as possible with their N use, accurate assessment of N in the soil is essential.
“Without this, inadvertent over-application is a real possibility and, in addition to the obvious environmental concerns associated with this, efficient N use is more important than ever when fertiliser prices are high.”
The consistency and accuracy of N-Min compared to other assays lies largely in its prediction of additionally available nitrogen (AAN) underpinned by a unique dataset, he explains.
“An SMN test gives you a snapshot of how much N is in the soil at the moment of the test, whereas N-Min test also calculates how much has already been taken up by the crop and the quantity of N likely to mineralise in the soil during the season.
“Putting all this together gives you the total soil nitrogen supply (SNS), which is the only way you can reach the correct starting point for calculating the remaining N needed to hit yield and quality requirements.
“Furthermore, N-Min’s final calculations are based on more than 25 years of data which allow it to make the correct adjustments for key factors such as soil type and other specific farm characteristics.”