
High prices and supply issues mean most growers are reassessing fertiliser use, and while many will tailor rates accordingly, could the solution actually lie in using available tools more strategically? CPM tackles the topic…
“It’ll pay to get soils analysed more regularly and have the information in front of you before tweaking any fertiliser plan.” DAVID BOOTY
By Mike Saull
Continuing geopolitical tensions and volatility in global energy markets are pushing up fertiliser costs and adding pressure to margins that are already tight. Subsequently, it should come as no surprise that growers are currently questioning the investment they’re making in inputs such as nitrogen, suggests AHDB’s Bek Hirstman.
However, there are tools to make decision making a little easier, she adds. The last time fertiliser prices spiked in similar fashion was 2022. In response, AHDB developed a nitrogen fertiliser adjustment calculator, based on the nitrogen recommendations for cereals and oilseeds from their RB209 Nutrient Management Guide. The takes into account fertiliser and grain/oilseed prices to give a suggested adjustment in the amount of nitrogen to apply.
To aide this critical decision-making further, AHDB now publishes fertiliser prices weekly instead of monthly. At the end of March, the price of imported ammonium nitrate (34.5% N) was £522/t with new crop wheat at £182/t. In this scenario, RB209 and the calculator suggested reducing nitrogen rates by around 35kgN/ha.
DOING THE NUMBERS
It was a similar picture at the beginning of July – with the same nitrogen source priced at £473/t and new crop feed wheat at £178/t, the calculator proposed a 30kgN/ha cut in nitrogen.
For Bek, it’s all about personalisation. She suggests plugging in supplier quotes for nitrogen and target grain prices and yields into the nitrogen fertiliser adjustment calculator. Based on the prices and product information, the calculator then suggests the break-even-ratio for the crop – the kgs of grain required to pay for a kg of nitrogen fertiliser.
While the same data is set out in RB209, this spreadsheet looks at a specific farm scenario and cropping pattern, giving a break-even scenario and likely loss if rates aren’t adjusted as indicated by the model.
But it doesn’t end there, with much onus on application timings, highlights Bek. “What it boils down to is, if it’s going to be dry, nitrogen won’t be taken up, so time applications so that N is applied in sufficient time to access the moisture it requires for uptake,” she adds.
“Be careful though, as too much nitrogen applied too early promotes vigorous growth and excess tillering which can’t be supported. If it looks like a dry spring, apply a larger proportion of your total N on at a second split, but also be aware that at this timing, it could be drier still for a longer period.”
Growers using soil and past cropping maps could variably apply fertiliser to good effect adjusting rates where the nitrogen fertiliser adjustment calculator suggests cost-savings can be achieved. Furthermore, research at AHDB’s Strategic Cereal Farm at Morley in Norfolk suggests overall yields align with historical performance, so targets should reflect what’s expect from the field.
However, the economic optimum varied substantially within fields when they were split into smaller nutrient management zones, as identified by technologies such as the use of an N-sensor. Arguably, this is where the story takes a twist as a relatively poor-performing area saw no yield benefit in applying nitrogen above 150kgN/ha, whereas a more productive area in the same field showed yield increases from applications up to 275kgN/ha.
In fact, the trials indicated that an application of 110kgN/ha yielded only 0.25t/ha less than the 150kgN/ha rate in the poorly performing zone, but rates could be cut by around 100kgN/ha in the higher-performing zone, while only sacrificing a similar yield (0.25t/ha).
“This clearly shows the benefit of understanding how crops respond to nitrogen across and within fields, and the trial suggests it could be worthwhile holding back on nitrogen in the traditionally better-performing parts of the field, depending on individual experience and market expectations,” explains Bek.
With fertiliser prices high and milling wheat premiums pressured, farmers may also be asking if it still pays to chase protein? RB209 guidance is clear – protein response is highly variable, influenced by the yield potential, season and premiums.
Where milling contracts are secure and realistic protein targets are achievable, late nitrogen may be justified, but the economics can be far from guaranteed. “Without that certainty, some crops may be better managed for yield and margin, rather than risking additional spend for an uncertain return,” suggests Bek.
BALANCING UP
Alongside nitrogen rates, growers should take into account the crop’s complete nutritional requirements to ensure that sulphur, phosphorous and potash, for example, are also in balance. With fertiliser prices high across the board and supplies limited, checking soil indices before establishing nutritional plans for next year’s crops will be critical.
“While it’s tempting to concentrate spend on the nutrient known to have the biggest influence on yield and cut back elsewhere, focusing solely on nitrogen is a little like trying to cook chips by adding more oil to the pan but never turning on the heat. The input is there, but the conditions required for it to work are not,” says Bek.
“If just one nutrient is deficient, others will be less effective and you must maintain or correct the balance accordingly. So now may not be the time to cut basal fertilisers or take a micronutrient holiday,” she warns.
Equally, Bek suggests that growers should look to maintain or improve levels of soil organic matter wherever they can. However, improving organic matter and a soil’s ability to hold nutrients more effectively takes time to fix.
She highlights that the AHDB soil health scorecard – which assesses physical, chemical and biological soil health indicators – is a good starting point in assessing general soil health and fields that require attention. Her advice is to reevaluate them every five years, or at the end of a rotation to monitor effects.
This Excel-based scorecard uses soil analysis results for core soil health indicators – soil structure (VESS test), pH, extractable nutrients (P, K and Mg), earthworm numbers and soil organic matter. These are compared with typical ranges for UK soil types and climate regions. A completed scorecard automatically produces a ‘traffic-light’ snapshot of soil health to guide management decisions and highlighting fields to focus on.
Considering assessable soil health factors such as earthworm numbers is a good place to start, believes Bek. “It means you can gain a clear picture of where soils are lacking and target improvements accordingly.”
David Booty, head of R&D at Omex, believes growers should dust-off and revise nutrient management plans, going over the principles once again. “While many will sample soils typically before a potato or vegetable crop in the rotation, it’ll pay to get soils analysed more regularly and have the information in front of you before tweaking any fertiliser plan,” he suggests.
He adds that RB209 is a reliable guide for soil types and crops, so decisions can be based on the tables in the document, or by using the calculators AHDB provides. However, he believes that even with fertiliser at more than £400/t and grain at £185/t, the recommended reduction in nitrogen use for optimum productivity could be relatively small.
“On top of this it’s important to remember that nitrogen doesn’t act in isolation – just half a point swing in pH value can have a significant effect on nutrient availability, so it’ll be worth checking for lime requirements and acting accordingly this summer.
“We’re also seeing declining sulphur levels in the spring, partly due to zero atmospheric deposition, but wetter winters are also contributing to leaching of sulphate.
“It’s also a case of ensuring both N and S are available throughout the growing season, so rather than just applying sulphur in one dose with the first spring application, consider using them together at each split. In addition, ensure manganese, magnesium and potassium are all in balance,” outlines David.
Once crops start growing, tissue or SAP analysis should help to pick up any in-season problems in supply, allowing growers to top nutrients up if required. But when it comes to efficient nitrogen management, David is a fan of mineral nitrogen testing. “Coming out of winter a SNS Plus test will not only assess current availability, but also provide a picture of what could be mineralised. Testing is particularly important where you’ve changed farming systems, for example, after a switch to minimum cultivations or the adoption of cover crops.
“On the back of our own trials we’ve been advocating putting more nitrogen on in the first split and using two, rather than three, applications in feed wheat. The work indicates that during the past 10 years, there’s rarely a disadvantage from front-loading early in March, perhaps with 60% of total nitrogen. This way, more of it is immediately available for uptake in wetter soils, should April and May be dry,” he explains.
ADDED BENEFITS
The twin-split approach can also save an application cost, and if applying liquid fertiliser, free-up the sprayer for pesticide applications, notes David. “While some would see this as adding to the risks of early leaching losses, it’s rarely a reality on medium textured soils unless there’s serious flooding.
“During a season, most leaching of nitrogen comes from the residues left from the previous crop and occurs during the winter. Unless you’re on the lightest textures, any new crop root system will take up most early-applied nitrogen, so risks are low.”
David points out that Omex’s UAN contains three forms of nitrogen – urea, ammonium and nitrate – to provide a three-phase, slow and steady release of crop-available nitrogen that can help to protect earlier-applied fertiliser. Equally, nitrogen inhibitors can also help to ensure what’s applied is better utilised.
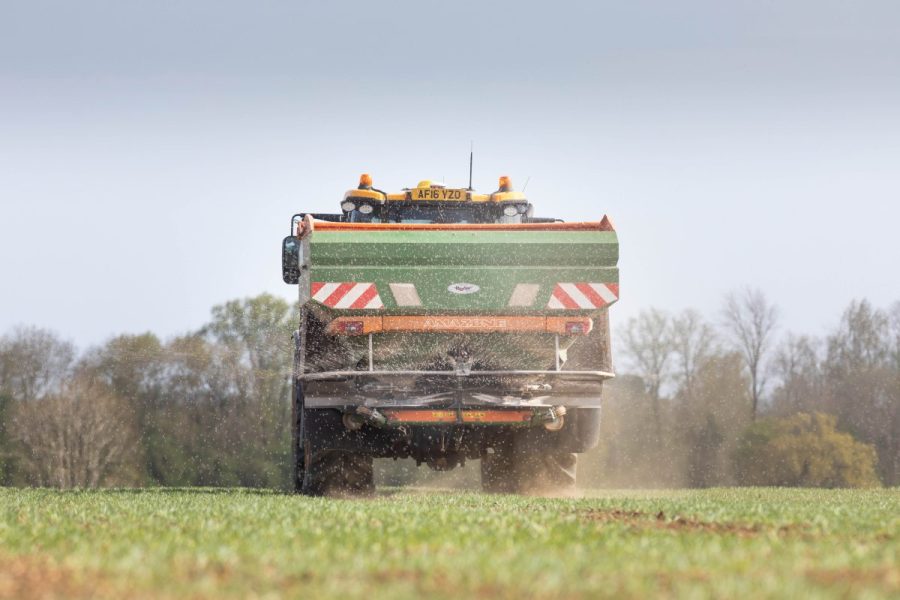
Growers who switch to liquid products often find a better, even spread across the field compared with granular products, raises David. “Also, at wide tramline widths, it’s less easy to get an even distribution of solid fertilisers, and underapplication at the edge of the field when looking to protect water courses can cut yields by around 1t/ha on smaller-sized areas. We also find in very dry conditions that liquid works more quickly; it’s a water soluble and this carries nitrogen into the soil more easily,” he concludes.
This article was taken from the latest issue of CPM. Read the article in full here.
For more articles like this, subscribe here.
Sign up for Crop Production Magazine’s FREE e-newsletter here.